

Squash is a highly demanding sport which requires a variety of physical attributes in order to play at a professional level. Amongst others, it requires physical strength, flexibility, quick reactions, stamina, and fitness. However, squash is not a sport whereby possession of a particular physiological trait, such as height, allows you to dominate over all others. A quick look at the top 25 players of each gender one can see that there are not many players who are excessively tall/short or light/heavy on the PSA World Tour. In fact there is a wide range of varying physiological traits indicating that any advantages posed by a particular trait can be overcome in one way or another. In this article we look at two specific physiological traits, namely the height and weight of players.
The data used in this article is taken from the player profiles on the PSA World Tour & Squash Info websites. The height of each player is assumed to be accurate and to remain constant throughout a player’s career. However it is very possible that a player’s physique and thus weight and BMI can change over time. In this article these possible weight variations are not considered and we assume a player has a constant and unchanging weight.
Height & Weight of Squash Players
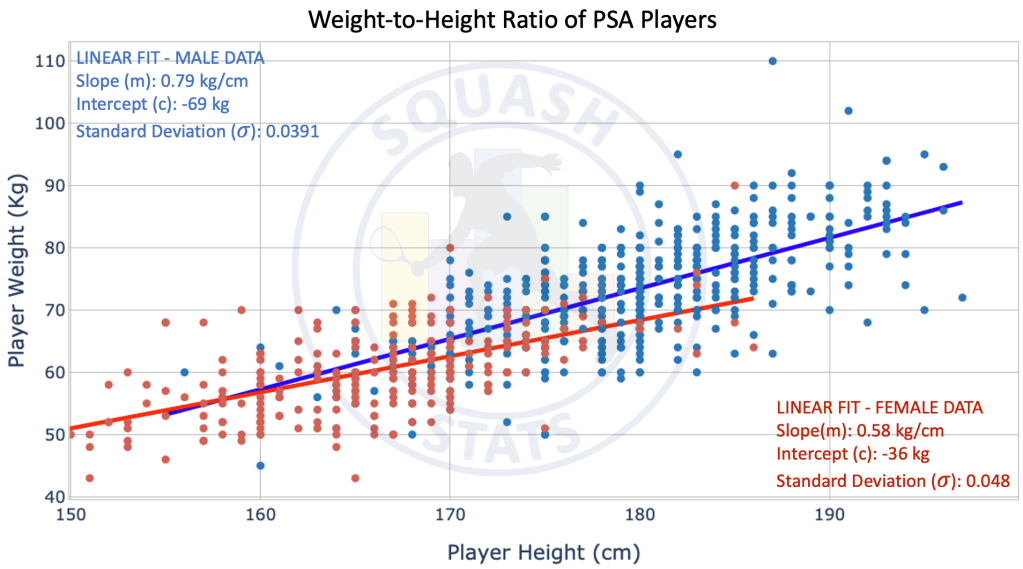
The plot below provides the weight to height ratio of the professional squash players (ranked 0 – 500) at a given particular time which is maintained throughout this article. In this plot each point represents an individual player. On the x-axis is the player’s height in centimeters and on the y-axis is the player’s weight in kilograms. The red dots are for female players and the blue dots are for female players. It can be seen that for both genders, as the players increase in height so too does their weight. This is of course very intuitive. It can also be seen that in general male players are taller and heavier. A linear line is fitted to the data of each gender and is shown in the below graph. This line illustrates the average weight of a player for varying heights, and vice versa. Details of the linear line are provided in the top left (male) and bottom right (female) corners of the plot. These lines have different slopes and thus diverge for increasing height. This essentially means that as players increase in height the average weight of each gender will differ and the larger the height the larger this difference will be. On average, a player’s weight will increase by 0.79 kg/cm and 0.58 kg/cm male and female players respectively. For a given height, on average males will be heavier than the average female player.
The following graph is identical to the one above but with the additional information of height and weight of the top 10 players of each gender. The rank of each top 10 player is indicated numerically and the gender is illustrated by the colour of the text and line. This information is also provided in tabular form below the plot where the weight, height and BMI is provided (the BMI will be expanded upon later in this article). As can be seen in both the table and the graph, the top 10 players are spread across the wide spectrum of heights and weights, both above and below the linear line indicating the average weight for particular height.


Height & Weight Distribution
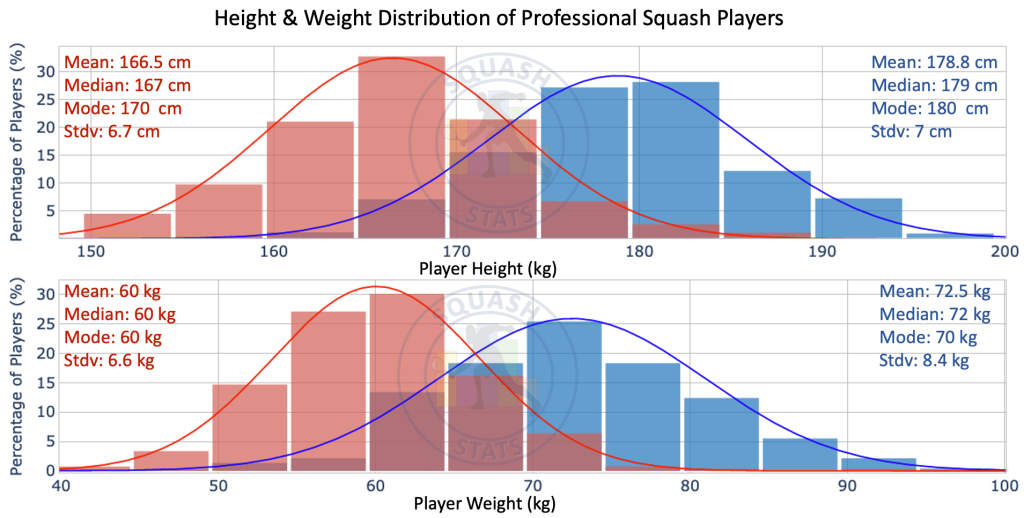
The above plots provide us with an indication of how the weight and height are spread across their respective ranges. However, it does not provide us with knowledge of how many players are within certain ranges. For example, there could be 100 players with the same weight and height and we would not be able to tell from the above plot. To explore this further the following plots show the distribution of the weights (on the left) and heights (on the right) of male (upper) and female (lower) players in the form of histograms. The x-axis shows the height/weight and the y-axis shows the percentage of players. Each histogram is plotted with a bin size of 5, meaning each bar represents the percentage of players within a 5 kg span (for weight) or 5 cm span (for height). For example, if we examine the weight of male players (top-left graph) one can see that approximately 25% of all male players have a weight between 70 – 75 kg.
It can be clearly seen that each distribution follows a normal (Gaussian) distribution as expected. The basic statistical metrics of the normal fit (mean, median, mode and standard deviation) are provided for each histogram. One can visually see that for both height and weight that the female distribution lies to the left of the male distribution. This just means that the females, in general, are smaller and lighter than male players. This is also confirmed by comparing the mean weights and heights where the female values are always less than their male counterpart. The mean weights are 72.5 kg for male players and 60 kg for female players. The mean height for male players is 179 cm and 167 cm for female players. Once again we can come to the conclusion that female squash players are shorter and lighter than male players, which is what would be expected.The standard deviation (labeled stdv on the plots) gives us information regarding the dispersion of the heights and weights. Essentially the larger the standard deviation the larger the spread of values. In fact the standard deviation works on the empirical rule (aka the 68-95-99 rule) whereby 68% of the data is within 1 standard deviation of the mean, 95% of the data is within 2 standard deviations of the mean, and 99.7% of the data is within 3 standard deviations of the mean. As an example, if we look at the distribution of male weights (top left), it has a mean of 72.5 and a standard deviation of 8.4 kg. Using the empirical rule we can therefore say that 68% of players are within 72.5 ± 8.4 kg (i.e. 64.1 – 80.9 kg), 95% of players are within 72.5 ± 16.8 kg (i.e. 55.7 – 89.3 kg) and 99% of players are within 72.5 ± 25.2 kg (i.e. 47.3 – 97.7 kg). The same principles can be applied to all both genders, and both height and weight.

For a direct comparison of the difference in weights and heights between the genders, the male and female weights (lower) and heights (upper) are plotted simultaneously in a histogram with the statistical information provided. Here the difference in height and weight between both genders is clearly evident. Below this histogram the information is also plotted in a density plot which again illustrates the difference between the physique of male and female players. In this density plot the darker colours represent a larger number of players.

Body Mass Index
The above study analyses the independent distribution of players weights and heights. In general, a person’s weight will increase with the height. This is reasonable and is what we saw in the first section. The person’s height and weight can be combined into a single metric known as the body mass index (BMI). This can be defined as the value derived from the body mass divided by the square of the body height, and is universally expressed in units of kg/m2. It is often used a measures of ones fat content based on the relationship between a persons weight and height. Although this is an adequate method for the general public, it is not a good ‘fat measurement’ system for athletes as their bodies are usually composed of much higher proportion of muscle which is known the weigh more than fat. The BMI can thus be an indication of increased muscle mass.
As with the height and weight of players, the following graphs show the BMI distribution of squash players for both genders. It can be seen that although their weights and heights differ considerably (above graphs) both genders have a very similar BMI distribution with only 1 kg/m2 difference between their means. However, the female players have the slightly lower BMI. This is most likely due to the fact that men, in general, have a larger muscle mass and thus a larger BMI. The average male squash player has a BMI of 22.6 kg/m2 and the average female has a BMI of 21.6 kg/m2

The following table represents the physical parameter of the average squash player for both genders. The standard deviation is also provided in order to understand the spread of players.

Height, Weight & BMI Percentiles
A percentile is a measure used in statistics indicating the value below which a given percentage of observations in a group of observations falls. As an example, if we say the 75% percentile for the weight of male squash players is 78 kg, this means that 75% of all male squash players are under 78 kg. The percentiles for the heights, weights and BMI indexes of squash players are plotted below for both genders. The generally used percentiles are tabulated in each plot and the 50% percentile is illustrated on the plots with the dashed line. The 10% and 90% percentiles are useful figures of merit as they provide reasonable lower and upper bounds of the distribution. Also the 50% percentile is essentially the median of the distribution.


Weight, Height and BMI according to PSA Ranks
As mentioned earlier, tall players have an advantage over smaller players in that they have a much longer reach, it takes them less steps to cover the court, and more difficult to lob. In the first section we looked at the height, weight and BMI of the top ten players of each gender and observed that each spanned across a large spectrum. This gives an indication that there may be no link between rank and body size and player rank, or at least is not well defined. To explore this concept a further we have plotted the players rank against their height, weight, and BMI index for both genders. The black line in each graph was generated by taking a moving average of the data and it therefore acts as a representation of the mean weight / height / BMI over the previous 10 ranks. At a first glance all graphs look pretty much like noise indicating that there doesn’t seem to be any clear relationship between a players rank and their weight, height or BMI index. However, on closer examination of the graph for the male players, it appears that for the first 250 ranks the average weight of a player decreases for increasing absolute rank. This trend cannot be seen in a players height and thus the weight – to – height ratio decreases, forcing the BMI to also decrease. This trend is not seen in the female data where there are no observable trends.


Shown below is a closer inspection of the weight and BMI of male players for the first 250 ranks. There is also a linear curve (solid line) fitted to the data which illustrates how the average weight and BMI of players decrease with increasing numerical rank. The slopes of the lines tell us the average rate of change a players weight and BMI with rank. For example, the slope of the weight variation is -0.017 kg/rank, meaning that for every rank position the average weight of a player decreases by 0.017 kg. Thus the weight difference between the number one and number 100 should be 1.7 kg. Although there is a trend, it is indeed a small trend.

As can be seen from the above plot the weight and BMI varies a lot even though the average value decreases with increasing numerical rank. Due to this variation it is still not possible to say that the player ranked at 100 will be 1.7 kg lighter than the player ranked at number 1. This trend is thus better at predicting the players weight and BMI for rank ranges. To illustrate this we look at the distribution of weights, heights and BMI for different ranges of player rankings. The players were thus split into categories according to their rank at that particular time and the distributions of weight, height and BMI were statistically studied. This is shown below for male squash players where the ranks are split evenly into 1 – 50, 51 – 100, 101 – 150, 151 – 200. The distributions do not perfectly fit the normal distribution but this is expected given the small number of samples. As can be seen from the mean weight values on the graphs decrease for increasing rank range. Nevertheless, the normal distributions are expected to be accurate. As determined from the above graph, there is no discernible relationship between rank range and height with the mean height for each ranking group being very close to each other. When one looks at the mean BMI values they can see that the BMI also decreases for increasing numerical rank.


The above study shows the link between the male players weight and their rank within the top 250 ranks. However, this was for the ranks at a particular point in time. It is possible that this is just a coincidence. The study was repeated for players’ weight, height and BMI for players who had careers in the last 20 years. However, instead of using a player’s rank at a particular time, each player’s highest rank was taken. Then the average weight, height, and BMI of each rank was taken. Again a similar trend was seen for male squash players whereby the average weight and BMI of players in a particular rank decreased for increasing numerical rank for the first 250 ranks. This tells us that this has been a constant trend and also that the weight distribution of players has not changed over the years. When this process was repeated for the female data, there was no relationship found between the ranks and any physical property.
The Weight, Height and BMI by Country
The following links provide information regarding the average height, weight and BMI of nationalities for both genders. To explore these parameters for professional squash players the players were grouped into their respective gender and country and the means were determined. In order to achieve reasonable statistical results, countries with groups of less than five players are excluded from this study. Otherwise the means would be too dependent on very few players or in many cases a single player. These results are plotted in horizontal bar charts below. Each parameter is split into the 2 charts; the left chart shows the largest ten and the right graph shows the lowest ten. In each bar is the name of the country as well as the number of players used to obtain the mean values.
As a brief summary of the male players we can say the following:
- Most of the tallest and heaviest countries are European
- The Dutch are considerably taller on average
- Most of the shortest and lightest countries are Asian
- The Welsh are among the tallest and heaviest male squash players. but their average BMI is considerably low in the top ten.
- Hong Kong are the shortest, lightest and lowest BMI
- Israeli’s have considerably larger BMI


The same analysis was performed using the female data.
- The female distributions of continents are much more diverse when compares to males
- As with the male players, Hong Kong players are on average, smaller, lighter and lower BMI


Height – to – Weight Ratio of Previous Number 1 Players
The below graph and table provides information regarding the weight, height and BMI index of the former number one players. Once again, one can see that there is a large distribution of weight-to-height ratios. although it should be noted that the majority of the male player are above the average line meaning that the number ones are heavier than average for their given height. This scatter plot includes players from the last 20 years


Comparison with Other Racket Sports
In the above analysis we have performed a thorough analysis of how the weight, height and BMI of squash players varies. These results are specific to the game of squash. But how do these physical attributes compare with other racket sports such as tennis and badminton. To explore this, data (height and weight) for the top 100 players of each gender for each sport was collected over the same time period. Our first indication can be observed by plotting the weight-to-height ratio of players in each sport and visually comparing their distributions. This is plotted below and it can be clearly seen that tennis players (both genders) have taller players, whereas squash and badminton player are smaller and look to have a similar distribution of weight and height. Once again the lines the graphs are linear fits and represent the average weight for any given height. For all sports these lines are very close together.


The main statistical parameters (mean, mode, median, standard deviation) of each sport is presented in the table below. Although the absolute weight, height and BMI ranges are different for both genders, the same trends are observed regardless of gender.
- Tennis players of both genders are substantially taller, than squash and badminton players.
- On average, male and female tennis players are 7 cm taller than squash or badminton players
- For both genders badminton and squash players are of a similar build with their height distribution being the same and squash players being slightly heavier This has a kick-on effect in the BMI where on average the squash player has a slightly larger BMI.


Conclusion & Outlook
PSA COO Lee Beachill has been quoted as saying “Squash has long had a reputation as one of, if not the single most demanding racket sport out there courtesy of the complex movements required and the repeated bursts of short, intense action with little rest periods – without mentioning the mental focus and concentration needed to compete at the elite level”. Due to these physical demands one might initially expect that this would translate into strict demands on physiological constraints such as weight and height. However, throughout this article it has been show that squash players of all heights and weights are distributed through the PSA rankings. This indicates that whatever advantages posed by a specific height, weight or BMI, these advantages are not so large as to create a dominance by these players. This indeed can be viewed as a positive in attracting new or younger players, in that is is a sport whereby people of all shapes and sizes have potential to reach to top ranks.
When the players physiological traits were explored per players country, it was determined that for male players the Europeans are the tallest and heaviest and Asians are the smallest and lightest. This trend is not observable in the female data where there seems to be a more even distribution of weight and heights among the continents
In addition to the ranked players at a particular point in time, the weight, height and BMI of players from the last 20 year were also considered, with the same trends as the current day players. Thus the size and shape of squash players has not changed to a large degree of the last 20 years.
When compared to other racket sports, squash and badminton players have very similar weight, height and BMI distributions, although squash player have a slight larger BMI on average. Tennis players however are taller on average.

Thanks for this information there are almost no resent studies about this important physical characteristics in squash.
LikeLike