

Professional squash is becoming more and more lucrative with the prize money available increasing year after year. Each season there are announcements of record-breaking prize money tournaments for both men’s and women’s squash. The 2018 – 2019 season saw the prize money of the women’s tour increase by 6.6% and the men’s tour increased by 12.2%. This is partially due to the new tour structure which was put in place with the aim of increasing the earning potential and playing opportunities across the entire PSA Tour. This blog post investigates how the prize money and ranking points are split between the tournament contestants (PSA World Tour tournaments only). Ranking points and percentage prize money breakdowns may vary from season to season, as the PSA restructures and refines its prize money and ranking points schemes. This blog however solely deals specifically with the 2018 – 2019 season.
Prize Money
We must first realize that not all tournaments have an equal amount of prize money. In fact the PSA World Tour is split into several tournament types which are defined by the on-site gross prize money offered. The following table gives the prize money ranges for the PSA World Tour tournaments in the 2018 – 2019 season where the values provided are for both genders. The ‘Player Draw’ column represents the number of players in the tournaments.

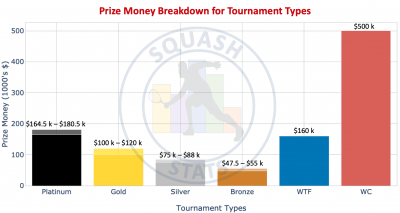
These numbers are graphically represented in the following chart where the tournament types are provided on the x-axis, and the prize money range is on the y-axis. The slightly lighter blocks on top of the Platinum, Gold, Silver, and Bronze tournaments indicate the ranges of the prize money variation. The difference in the prize money between all the different tournaments is clearly evident in this plot. It can be seen that, as expected, the prize money decreases as one goes from Platinum to Bronze. The World Championship has by far the largest prize money at $500k. The World Tour Finals prize money is between that of Platinum and Gold tournaments.

The above plot however does not take into account how the money is split nor the number of players in each tournament type. Although the World Championship has the largest prize money, we can see, from the above table, that it is split among the largest number of players (64 players). Also the Platinum tournaments have a larger number of players (48 players) than the Gold, Silver and Bronze tournaments (24 players each). In contrast, the World Tour Finals has a reasonably large prize money with a lower number of players (8 players). Therefore, a larger total prize money does not necessarily mean that participants get more money. The amount of money a player earns from a tournament depends on the number of players in each tournament and the percentages attributed to the final ranks of these tournaments. The percentage breakdown of the prize money for the tournament ranks is provided in the following table, where the different coloured tables represent tournaments with different numbers of players and thus different tournament types. Although the total prize money may vary depending on gender, the same prize money breakdown is applied identically for both male and female tournaments.

To get a better understanding of how the prize money is split among the ranks, the total prize money per rank range can be illustrated as a percentage of the total prize money. This is what is depicted in the pie charts below. In each segment, the text indicates the percentage prize money that is allocated for all players within the final rank range and the colour of the segment indicates the ranking rage which is provided in the central plot legend. For example, if we take the ’16 Draw’ pie chart as an example, 20% of the prize money is given to the rank #1, 14% of the prize money is given to rank #2, and for each of the players ranked between 3 – 4 each get 9% of the money, making a total of 18% for that rank range (in this case the segment represents 18% of the total prize money). The same logic can be applied to all other tournaments and pie chart segments.

The above pie charts represent the total prize money for a given ranking range, ranks 3 – 4 for example. It is also useful to see this data on an individually ranked player as is visually illustrated in a bar chart below. On the x-axis are the various types of tournaments categorized into their size and type, and on the y-axis is the prize money attributed to each of the final rank ranges as a percentage of the total prize money. Each ranking range is colour coded as is indicated on the legend to the right of the chart. As an example, if we look at the Platinum tournaments (i.e. 48 draw including 16 round 1 byes), the first blue bar is for final rank #1 and receives 16% of the total prize money. The third (green) bar is for players finishing either #3 or #4, meaning all players within this range each get 6% of the total prize money. From this chart one can see that for a given final rank (or even a given final rank range), the percentage of prize money given to the players within that range remains similar (within 4 percentage points) except for the World Tour Finals. This can be seen by comparing the same colours for each tournament type, which are of similar magnitudes. The discrepancy of the World Tour Finals is due to the fact that there are only 8 players in this tournament and thus the prize money is distributed over fewer players (and a smaller number of rank ranges), therefore the percentages for each range can be much higher.

From the above analysis we now have an understanding of the total prize money for each tournament type and the percentage breakdown of how this prize money is distributed among the players. By combining both of these independent studies, we can see how the actual prize money is split in each tournament in terms of actual real money rather than percentages. To do this we assume that the money of each tournament type is the maximum allowable value as is provided in the first table. This is illustrated in the plot below where one can immediately see the potential monetary benefit of winning the World Tour Finals and the World Championship which are much higher than the other tournaments. This graph can also be used to compare prize money for different final rankings in the various tournament types. For example, finishing with a rank of 4 in the World Championships (green bar) is approximately equivalent to winning a platinum tournament in terms of prize money. One can also see the decline of prize money as you go from Platinum to Gold, from Gold to Silver, and from Silver to Bronze tournaments.

Tournament Ranking Points
The ranking points that players receive vary according to the tournament type in a manner that is similar to how the prize money varies. The ranking points gained for each tournament are accumulated and used to determine the overall PSA ranking of the players. (Note: the ranking points are divided by a ‘divisor’ which is determined by the number of tournaments played and will be discussed later in this blog post). The tables below summarize how the points are distributed among the ranking players for the various tournament types. As with the prize money, the higher the level/grade of the tournament (excluding the World Tour Finals), the higher the total number of ranking points provided for that tournament. The World Championship gives the largest number of points, in combination with the largest total prize money (as seen in the previous section). For a given final ranking range, the points awarded to the players decrease as one goes from Platinum to Bronze. The Gold, Silver, and Bronze tournaments all have the same number of players (24 players) and likewise the percentage of points for a given ranking range are the same for all three of these tournaments. The platinum tournaments have more players (48 players) and thus the percentage of points will be a little less than the Gold, Silver and Bronze tournaments for a given ranking range due to the fact that the points are distributed over a larger number of players. The World Tour Finals provides ranking points only for the top 4 players, however players get a match win bonus as well as an undefeated bonus when applicable. Compared to the other tournaments, the World Tour Finals give relatively few points available but from the above analysis it can be seen that there is a large financial return (larger than Platinum tournaments but smaller than the World Championship).

To visually represent the above table, the below bar chart illustrates how the relative points vary between the different tournament types. On the x-axis are all the tournament types where each colour represents a ranking range, as is indicated on the legend of the plot. On the y-axis are the ranking points. Thus this bar chart allows us to see how the ranking points vary within each tournament type, as well as compare the relative ranking points between the different tournaments. For example, the winner of a Bronze tournament receives fewer ranking points than the fourth place of a platinum tournament.

Average Ranking Points
In order to use the ranking points to rank the players, as is done on the first day of every month by the PSA, the average number of points is used. For any given month, the first step in calculating a players average points is to determine the divisor, D, which is read directly from the tables shown below for both male and female players. It is essentially determined by the number of tournaments played (excluding the World Tour Finals) in the previous 12 month period. For example, a male player who plays 14 tournaments (not including the World Tour Finals) in a 12 month period, will have a divisor of 11 as read from the male table below.

The minimum divisor is currently set to 10 tournaments for men and 9 for women. This means that until a player has played this minimum number of tournaments over a 12 month period, the divisor will remain these minimum values respectively. This divisor term is then used in the following equation whereby the ranking points of the players top D tournaments are accumulated and divided by the divisor itself. The points gained in the World Tour Finals are effectively bonus points added to existing ranking points as is shown in the equation below.

Case Study – Karim Abdel Gawad
As a case study, let’s take a closer look at one of the top 10 players and discover how much prize money he earned as well and the number of points he achieved in the 2018 – 2019 PSA World Tour season. We will focus on Karim Abdel Gawad due to the fact that he has played in several different tournament types and finished in a large range of ranks. The table below gives a summary of his season showing the tournaments, locations, starting dates, tournament types, final ranks, tournament prize money, prize money earned by the player and points awarded to the player. During the 2018-2019 Season of the PSA World Tour, which is from September 2018 until June 2019 inclusive, Karim Abdel Gawad played a total of 14 tournaments (including the World Tour Finals) earning $175k, accumulating a total of 13,672 points.

To determine his average ranking points at the end of the season (which we will define as 01/July/2019) we first determine Gawad’s divisor as explained above. Karim Abdel Gawad did not play in any tournaments in July or August of 2018 which are included in the 12 month period of calculating the average points for July 2019. Given that he played in 13 tournaments (excluding the World Tour Finals) in the previous 12 month period, from the above table we can deduce that Gawad has a divisor of 10. We therefore sum up all the points Gawad earned from his top 10 tournaments (which are indicated by an asterisk in the table above) to get a total of 11,110 points. We then add the points awarded in the World Tour Finals (1,300 point – 1,000 for winning and 2 x 150 = 300 as a match-win bonus) resulting in a total points of 12,410. We then divide this number by the divisor itself (10 in this case) resulting in 1,241 average points which exactly matches the Gawad’s average points for July 2019 as can be seen here. Filling in the average points formula looks like the following

A pie chart can be effectively used to illustrate which tournament types Gawad earns the most points and prize money from. It also illustrates the discrepancy between the ranking points and prize money. For example, Karim Abdel Gawad earned a substantial $48k in the World Tour Finals which was 27% of his total prize earnings, but this tournament only provided 8% of the ranking points. Conversely, he won $81k from Platinum tournaments, which amounts to 47% of his earnings, and these tournaments constituted 63% of the total ranking points. Similar comparisons can be made for all the tournament types.

The below charts illustrate the number of points (upper) and prize money (lower) accumulated by Karim Abdel Gawad per month. Of course this purely depends on the type of tournaments per month, and final ranking positions in these tournaments but in general one can see a trend where ranking points is directly proportional to the prize money earned. The main deviation from the general trend is in June where a medium-low number of ranking points was received but a larger amount of prize money was earned. This is due to the fact that Gawad won the World Tour Finals this month which provides a large amount prize money (due to a low number of players) but a relatively low number of ranking points.

Conclusion & Outlook
This article provided a statistical analysis of how the prize money and ranking points are distributed among the players for the PSA World Tour tournaments. Graphic illustrations are used to depict and contrast both the distribution of points and prize money for the various tournament types. A brief description is also provided as to how the ranking points translates into a method of ranking the player by deriving the average ranking points for each player. The article concludes by focusing on Karim Abdel Gawad and describing the prize money and ranking points earned during the 2018-2019 PSA World Tour season. A future blog post will focus directly on the financial earnings of all the players and compare them to each other. Potentially, in combinations with the season tournament calendar the above analysis can be used to optimize a players season in terms of earning the most amount of money and gaining the number of points per tournament. For example, it may be more beneficial (in terms of prize money and ranking points) for a player ranked at number 15 to enter a Bronze tournament with a higher probability of finishing in the top 4, rather than enter a Platinum tournament and get knocked out within two rounds.
Data Source
| Parameter | Description |
| Data Source | PSA World Tour Media Guide: click here |
| Start Date | 01-September-2018 |
| End Date | 31-May-2019 |
| Tournaments | PSA World Tour: Platinum, Gold, Silver, Bronze, World Tour Final, World Championship |
| Data | Tournament prize money, tournament points, number of tournament players |
