Unfortunately the 2019 – 2020 PSA World Tour season came to a premature and abrupt ending due to the spread of COVID-19. The season ended as of March 13th, with Canary Wharf in London, England being the last male tournament and CIB Black Ball Open in Cairo, Egypt being the last female tournament of the World Tour season. Nonetheless, it was an exciting season with the usual ups and downs of several players. We saw Hania El Hammamy win her first Platinum tournament, Paul Coll reach his first Platinum final, Joel Makin reach the top 10 for the first time (the first Welshman since David Evans in 2002), Mohamed El Shorbagy retake his number one position after one year as a number two seed, and Nouran Gohar reclaim her personal best ranking of #2 after almost three years.
Given that the season was incomplete, it is difficult to deduce statistical conclusions if they are to be compared to the previous year. Much of the data presented here is artificially skewed due to the fact that much of the season did not finish and thus the data cannot be included. In this blog posting we look at the tournaments by gender, by tournament type, and by location. We then look at the winners of these titles as well as the earnings of the PSA players.
Tournament by Gender
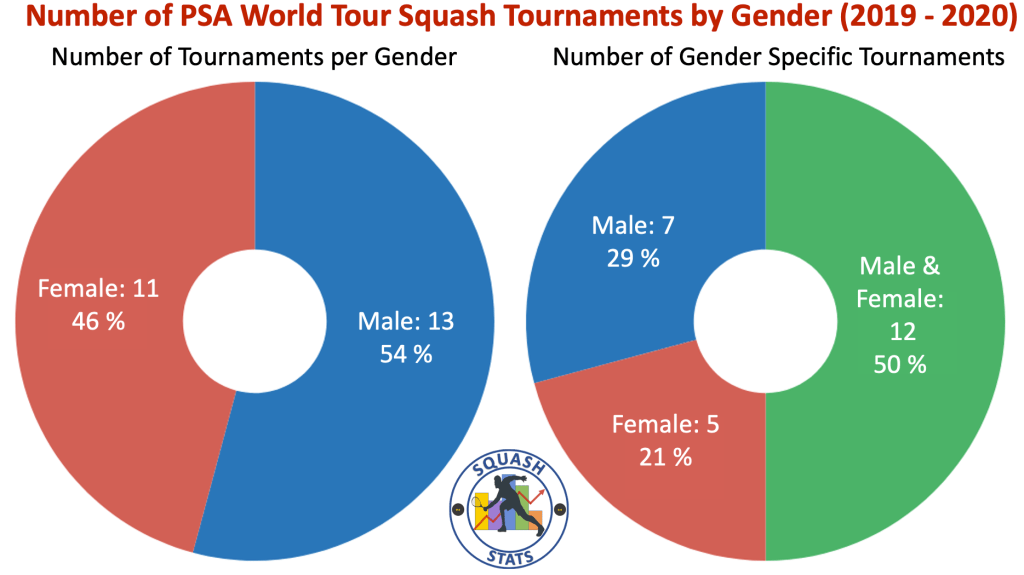
Let us first take a look at the number of titles in which male and female contestants compete. The pie chart below, on the left, illustrates the ratio of the male to female number of tournaments. For this particular pie chart, all gender tournaments are considered as individual tournaments (i.e the Oracle NetSuite Open is considered as one female tournament and one male tournament). It can be seen that the male players have a total of 13 tournaments (which is 54% of all tournaments) and the female squash players have 11 tournaments (which is 46% of all tournaments). Of course these numbers do not represent the number of tournaments each player of each gender enters but rather the maximum number of tournaments available to that particular gender.
The pie chart below, on the right, breaks the tournaments into categories depending on whether or not the tournament is a single-gender or dual-gender tournament. For this pie chart you can see that there are seven male-only tournaments (29%), five female-only tournaments (21%) and 12 dual-gender tournaments (55%). Note that the 12 dual-gender tournaments are in fact 6 tournaments but as previously mentioned we count it as one male tournament and one female tournament, and thus the number doubles. One can see that 50% of all tournaments are dual gendered. Regarding the single gendered tournaments, one can see that there is a larger proportion of the male-only tournaments when compared to the female only tournaments.
Tournaments by Tournament Type
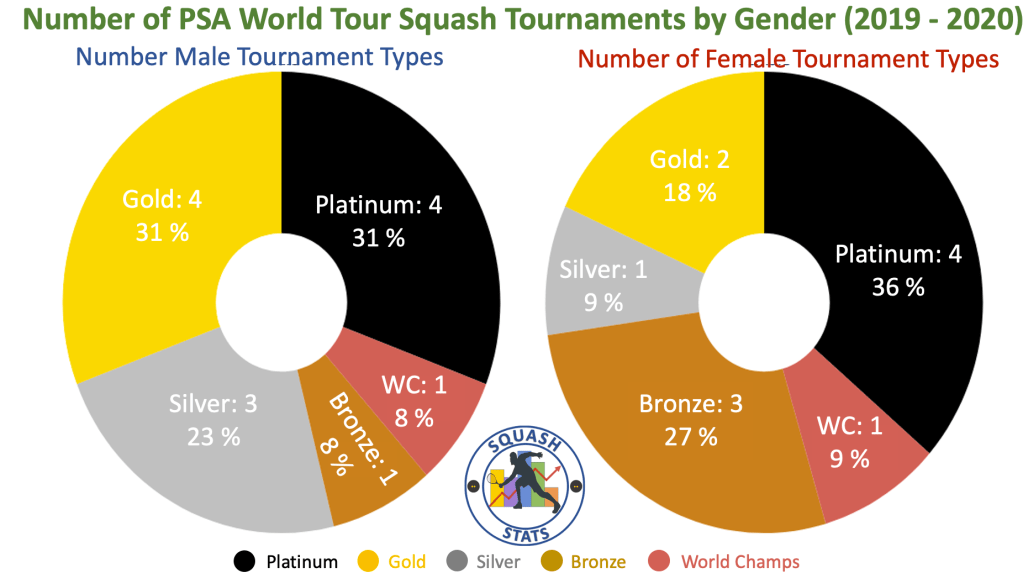
We can also categorize the above pie chart into the tournament types. The below pie charts illustrates how many tournaments of each tournament type both genders have available to them. For example, male players had four Platinum tournaments, four Gold tournaments, three Silver tournaments, one Bronze tournament, and one World Championship. Similar parameters can be extracted from the right pie chart which illustrates the number of each tournament type for the female players.
Tournaments by Location (Continent & Country)
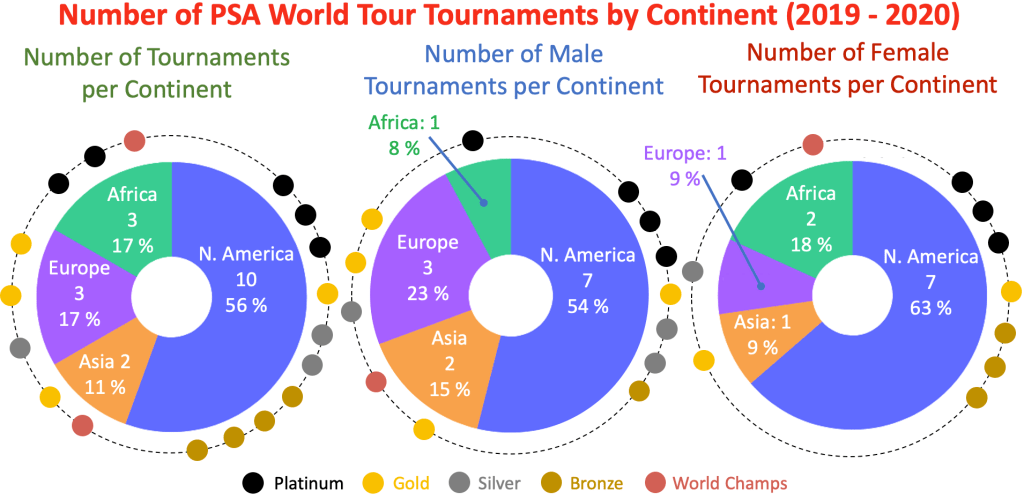
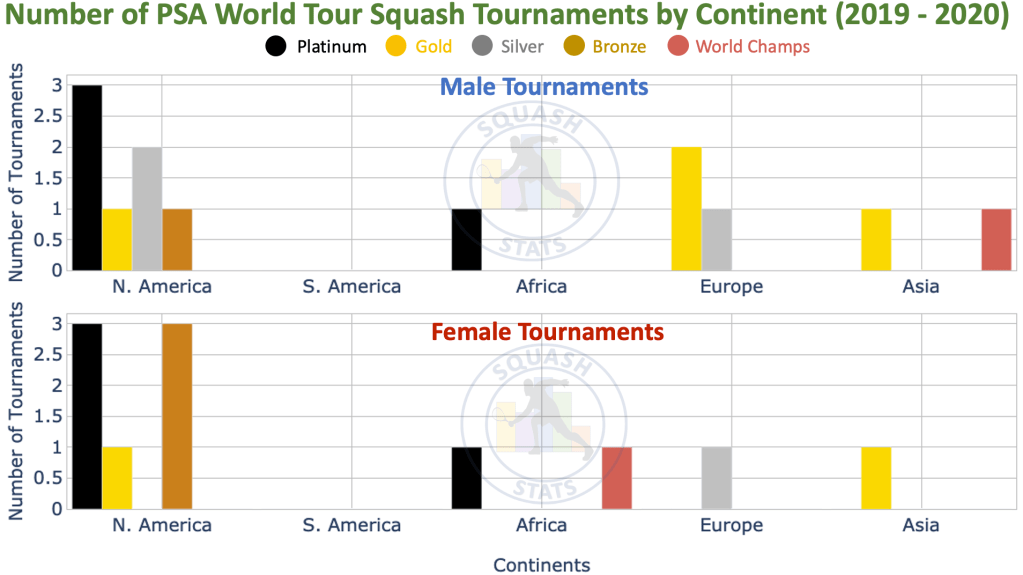
The tournaments can also be looked at in terms of location. The below series of pie charts illustrate the number of tournaments in each continent for both male and female tournaments combined as well as the individual genders. The coloured circles on the perimeter of the pie charts represent a single tournament in the adjacent continent and its colour represents the tournament type. For example if we focus on the number of tournaments per continent for males and females together (left most pie chart) we can tell that there are 10 tournaments in North America, three of which are Platinum, one Gold, two Silver, and four Bronze. For both individual genders it can be seen that the majority of tournaments are in North America. This data can also be illustrated on a bar chart which is depicted below the pie-charts for male and female tournaments individually. In these charts the continents are grouped on the x-axis, the number of tournaments is indicated on the y-axis and the type of tournament is indicated by the colour of the bar.
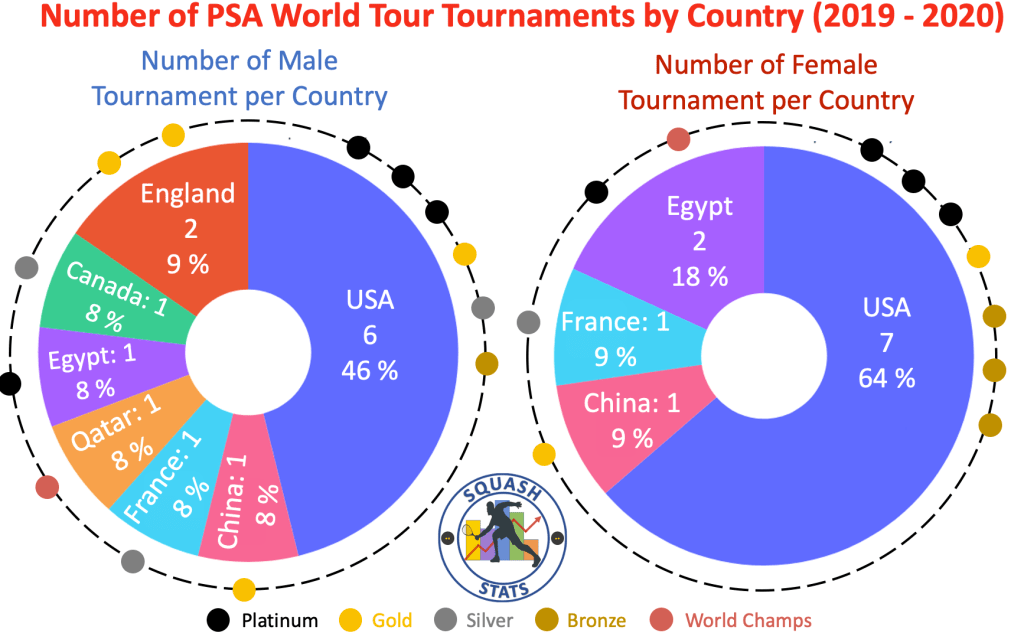
This data can also be split into individual countries as is shown in the pie chart below. The balls around the perimeter of the pie charts serve the same purpose as before. It is clearly seen that the USA dominates the number of tournaments, with the other countries only having a maximum of two tournaments. Of course this is mainly due to an incomplete season.
Tournament Winners & Runners-up
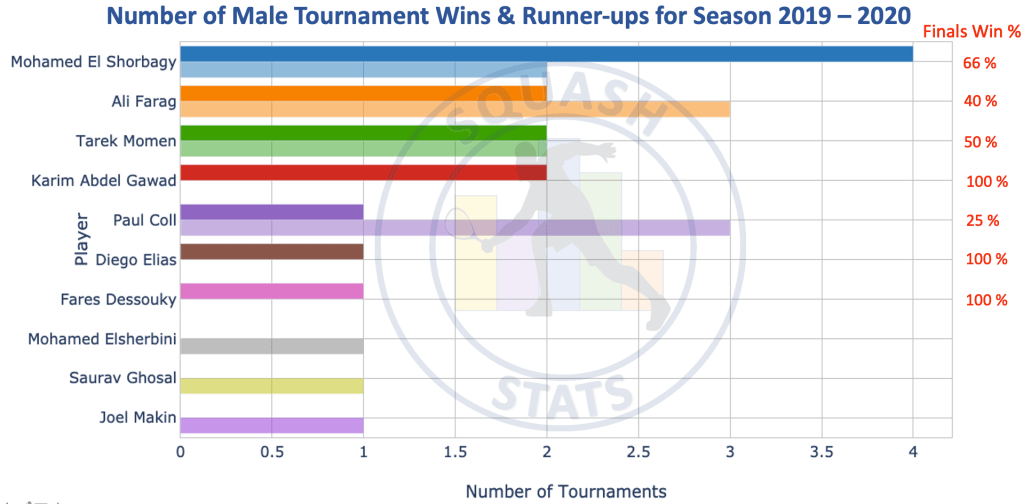
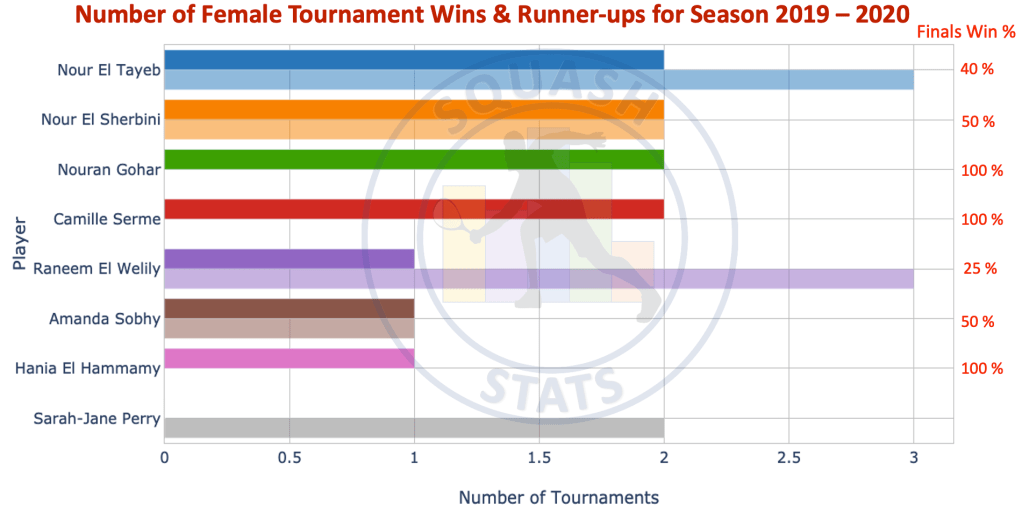
In the following two horizontal bar charts, the number of PSA World Tour tournaments won by the players (male: upper chart, female: lower chart) is depicted in descending order. In fact, on closer inspection one can see that each player has two bars attached to its name; the upper darker color is the number of PSA World Tour tournaments won, and the lower lighter colored bar is the number of runners-up positions obtained by that player. It is of no surprise to see Mohamed El Shorbagy at the top of the chart with a total of four tournament wins. Three players, Ali Farag, Karim Abdel Gawad, Tarek Momen each have two tournament wins. All 13 of the PSA World Tour male tournaments were won by seven players. For the female tournaments, Nour El Sherbini, Nour El Tayeb, Noran Gohar and Camille Serme all won two tournaments. All 11 the PSA World Tour female tournaments were won by seven players. On the right hand side of these plots is the finals’ win percentage. This is the percentage of finals won out of the number of titles played for a given player. For example, Mohammed El Shorbagy won four finals, and came as runner-up on two occasions making a total of six tournament finals. Therefore, his finals win percentage is 66% (four out of six) finals played.
Tournament Winners by Tournament Type
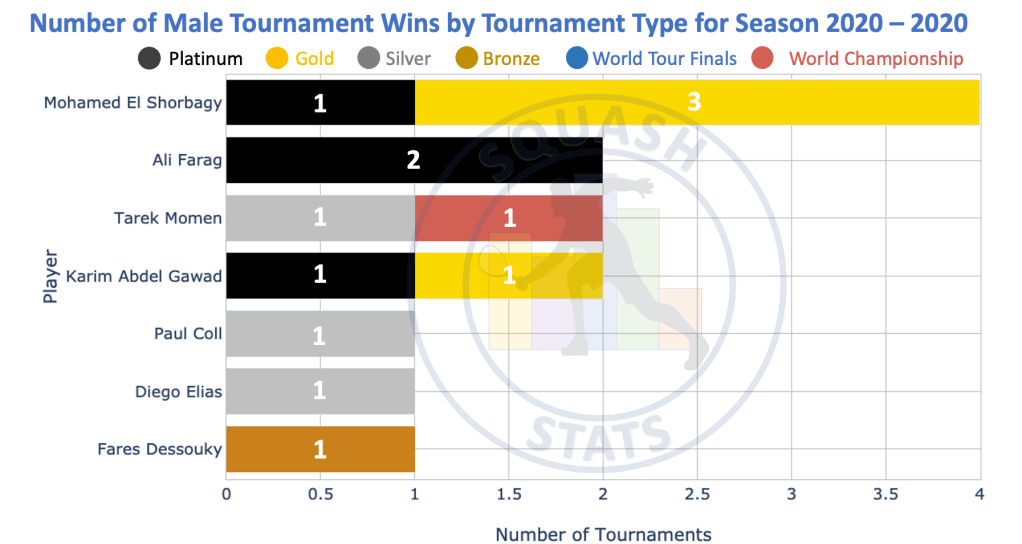
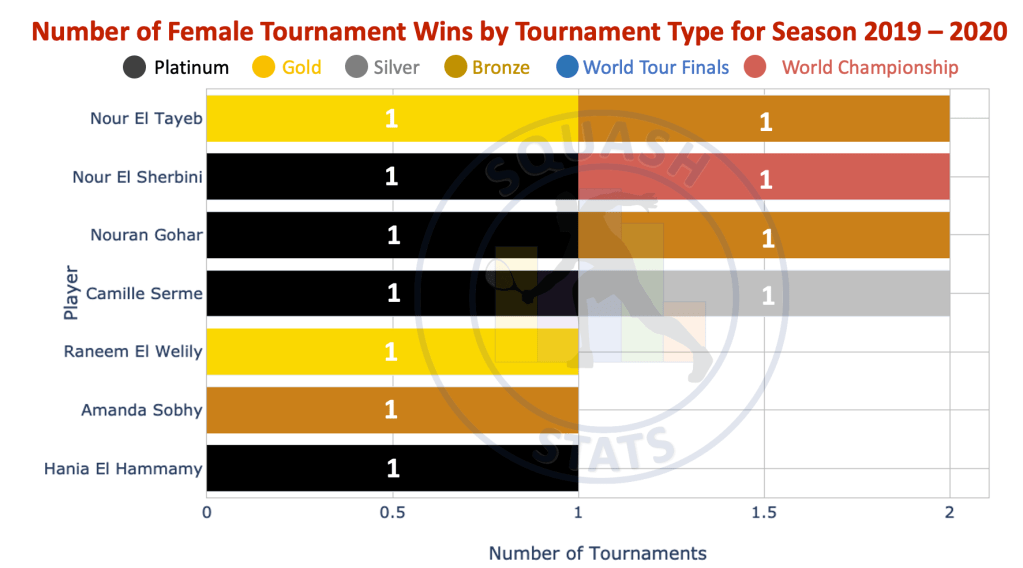
Looking at the number of tournaments won by each player in the above section can be a good indicator as to who dominated the seasons’ tournaments, and who converted the most finals into winning titles. However, it does not take into account the type of the tournaments won. For example, there is a big difference if player ‘A‘ wins six bronze tournaments and player ‘B‘ wins six platinum tournaments, however their success would both be ranked the same in the above plots. To gain a better understanding of this the plots can be color coded to indicate the tournament types. This is what was done for the following two plots whereby the colors indicate the tournament types which are shown in the legend of the graph (runner-ups are not shown).
For the male tournaments, it can be seen that the Platinum tournaments are all won by only 3 players, namely Ali Farag, Mohamed El Shorbagy and Karim Abdel Gawad. These are all Egyptian players showing their dominance in their ability to win tournaments. This is in fact the exact same as last season reinforcing the Egyptian dominance over time. Similarly in the female tournaments, all but one of the Platinum tournaments are won by three Egyptian players (Nour El Sherbini, Nouran Gohar and Hania El Hammamy). In addition to this feat, the Egyptians won the World Championships in both genders cementing their tournament dominance in the 2019 – 2020 season.
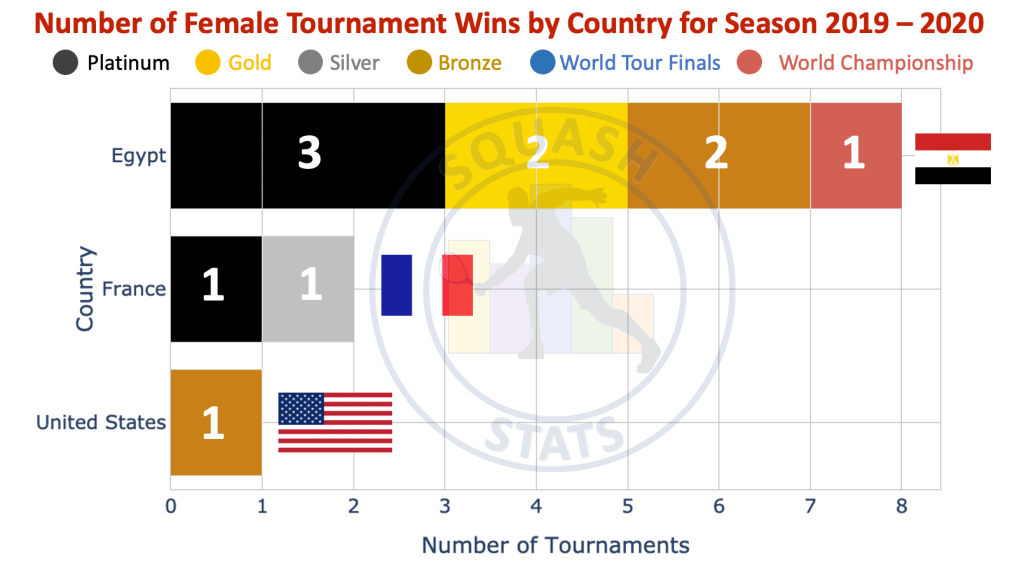
Title Winners by Country
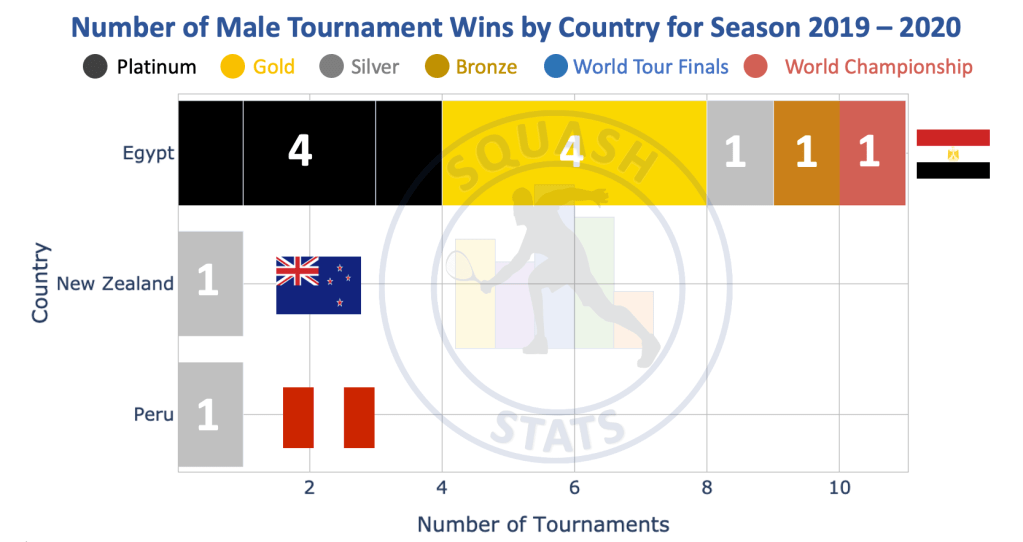
In the above section we can clearly see that there is a dominance of Egyptian players in terms of winning the male and female tournaments. This is not surprising given their overall dominance in the game in recent years, but perhaps it is not yet clear how dominant they were in the 2019 – 2020 season. The graphs below plots the tournament winners by country for both genders. In the male tournaments, Egyptians clearly dominated the tournaments winning all tournaments except two Silver tournaments. A total of 11 of the 13 male tournaments were won by Egyptian players (84% tournament win rate). Similarly, 8 of the 11 female tournaments were won by Egyptian players (72% tournament win rate).
Prize Money by Tournaments
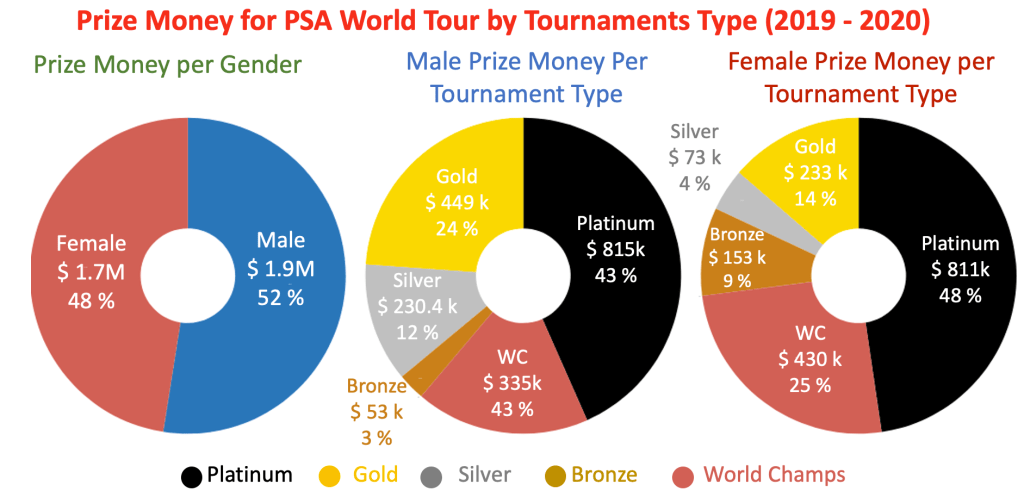
Now that we have looked at the number of each type of tournament, as well as their location, we now look at the prize money of these tournaments. The pie chart below on the left hand side shows how the total prize money for the entire season was split according to gender. As can be seen it is almost a 50:50 split, with $1.7M (48% of the total prize money) and $1.9M (52% of the total prize money) provided for the male and female tournaments respectively.
The remaining two pie charts split the prize money up according to tournament types for each gender. For example, the middle pie chart represents the division of prize money for the male tournaments where $811k is provided as prize money for the Platinum tournaments which is 43% of all the prize money provided for all the male tournaments. The same logic is used to deduce the amount of prize money for each tournament type.
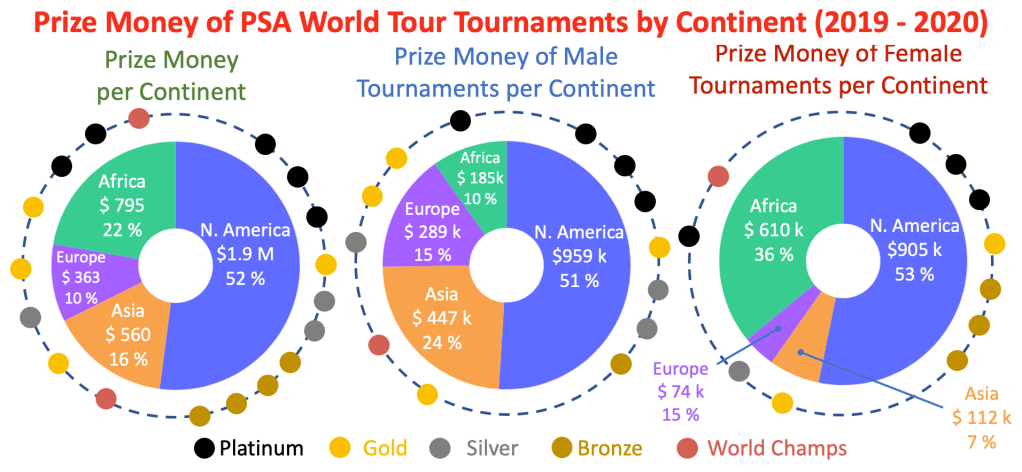
Prize Money by Location
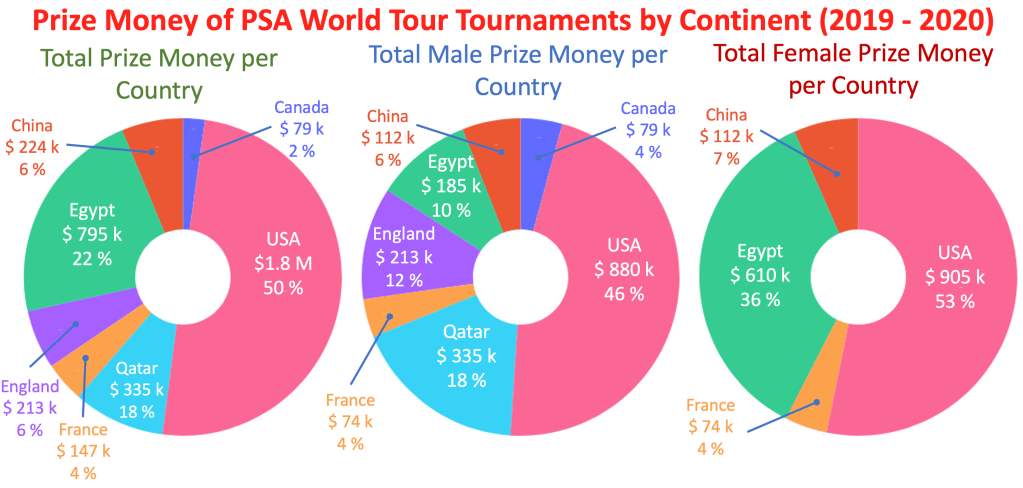
The following charts illustrate how the prize money is provided according to tournament locations. The three pie charts below show how much each continent provides in terms of prize money. The chart on the left illustrates this for the male and female tournaments combined and the remaining two for the male and female tournaments respectively. It can be seen that for each gender North America provides most of the prize money (more than 50% for each gender). Once again the balls around the perimeter indicate the type and number of tournaments in each continent. For both genders it can be seen that a large portion of the prize money is provided by the continent which held the World Championships (Doha, Qatar, Asia for the male WC and Cairo, Egypt, Africa for the female WC).
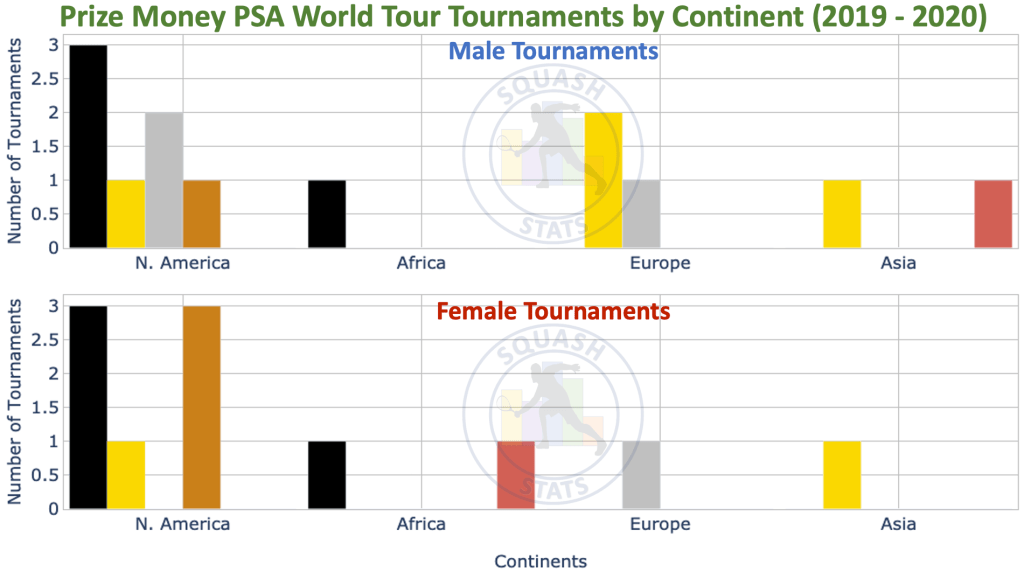
The lower plot illustrates the same data but in bar chart format where the continents are plotted along the x-axis and on the y-axis is the prize money amount. As can be seen from the chart, each continent on the x-axis is also split into tournament type categories. On close examination the continuity between the two methods of data presentation can be seen.
The above charts can be further subdivided into countries rather than continents. This is what is illustrated below in the pie charts. For each gender it is clearly seen that USA provides the most prize money. For the female tournaments, USA and Egypt together provide 89 % of all the prize money for the season.
Prize Money Earnings
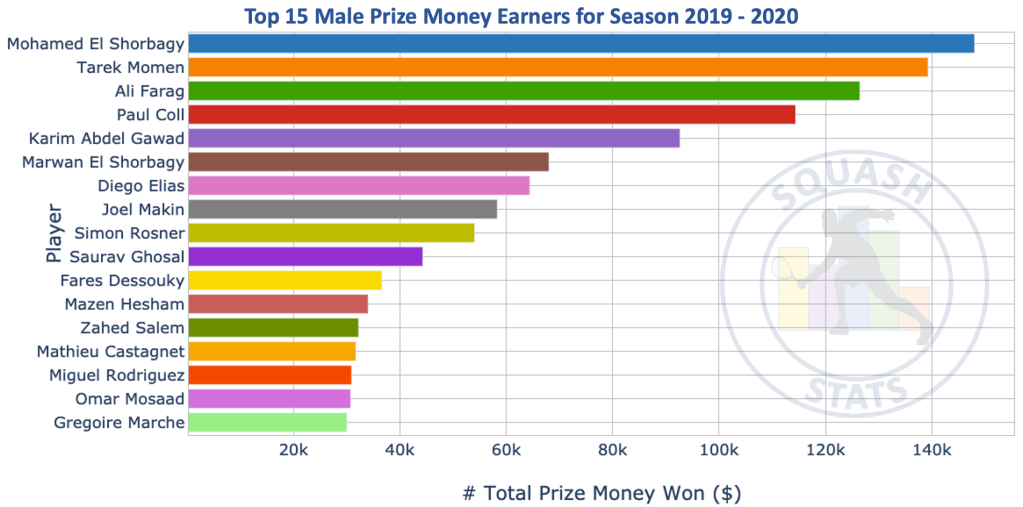
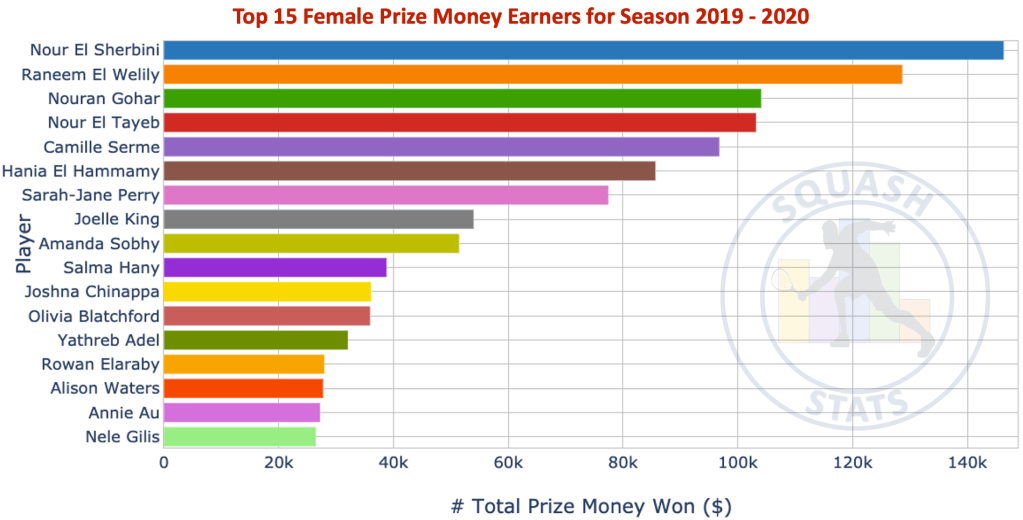
Tournament titles, ranking points, ranking positions, are all coveted by the professional squash players. The important word here is ‘professional’. This is how they earn their living. So let’s take a look at the players’ prize money earned for the season in question. Note that this study only takes into account the total prize money it does not take into account additional income (e.g. sponsorships) or deductions (e.g.player fees, administration fees, accommodation etc) . For a detailed summary of how the Prize money is split among the players please see our blog posting entitled: Prize Money & Ranking Points in PSA World Tour Tournaments . The below bar charts show the top 15 prize money earners for both genders. The ranking of the prize money earners is pretty much what is expected, the higher ranked player the higher the earnings. It is also noted that the earnings are very similar for both genders.
The above bar charts show the total earnings of the players of the played season. However, it is also interesting to split these totals into tournament types whereby one can see how much is earned from the different tournament types. This is illustrated in the following two graphs for each gender.

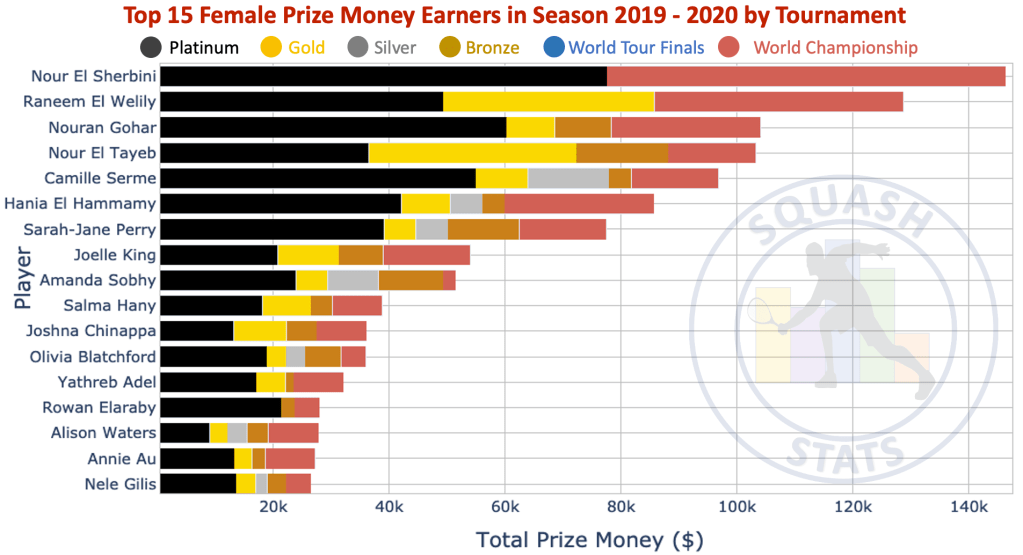
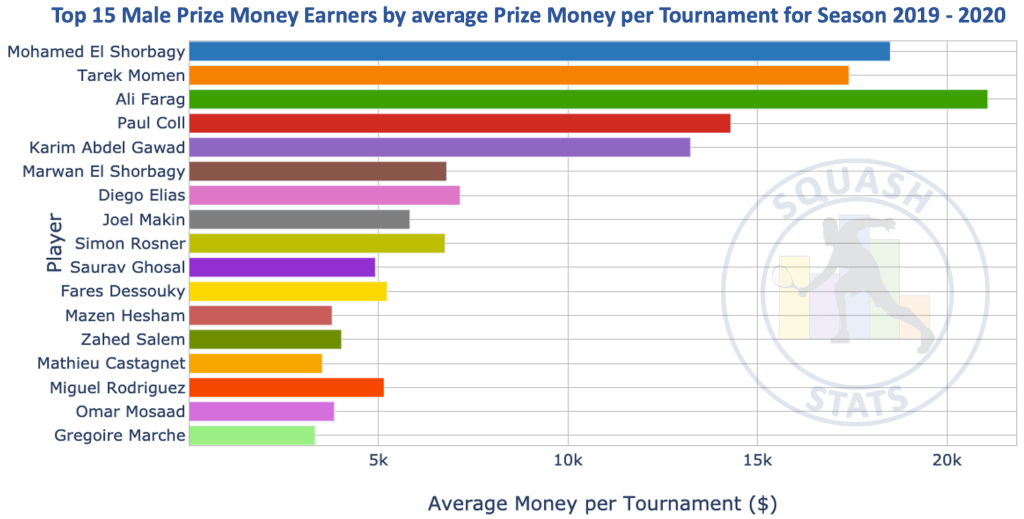
It is also interesting to know the average prize money earning per tournament. Players play different numbers of tournaments and different tournament types. The average prize money per tournament compensates for this to determine, on average, how much a player earns per tournament. For example, Ali Farag earned less prize money than Mohamed El Shorbagy by $ 22k due to the fact that he played less tournaments. However, Ali has earned more prize money per tournament player as can be seen in the graph below.
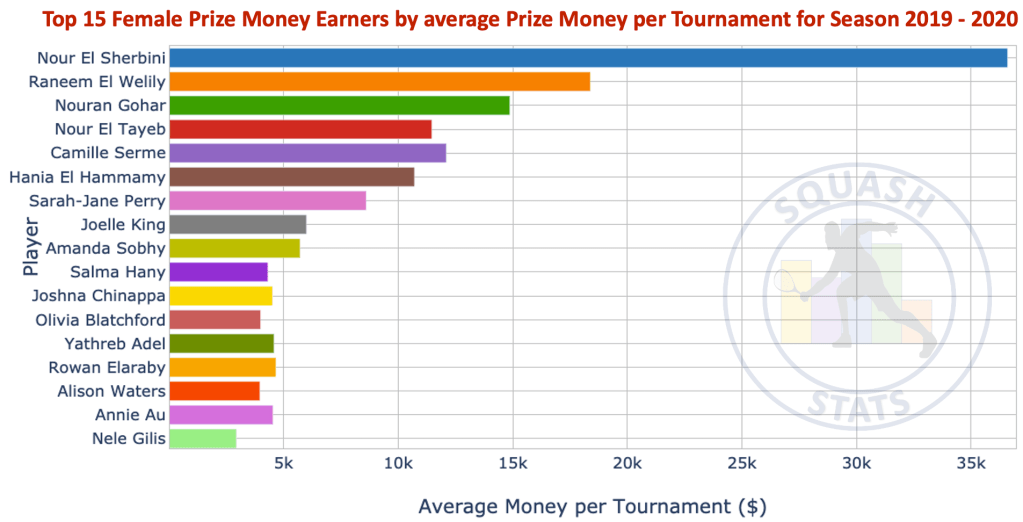
Nour El Sherbini has by far the largest prize money earning per tournament, this is mainly due to her playing in only four tournaments (three Platinum tournaments and the World Championships) and always reaching the final (twice runner-up and twice title winner). This large prize money per tournament is also inflated due to El Sherbini winning the World Championship which had a purse of $430k.