

Professional squash is without a doubt becoming more and more lucrative as a profession. The 2018 – 2019 season saw a record breaking prize money total of $7,569,706 when the tour structure was changed. Currently, there are hundreds of PSA tournaments throughout the course of a season which are classified into the following categories, based on prize money: Closed Satellite, Challenger, International, World Series, World Championship. For further details on these tournaments and associated prize money click here. Over the last twenty years professional squash has gone through several restructurings of how tournaments are graded, named, how the prize money is split etc. This article looks at the amount of prize money invested into professional squash for all tournaments over a given season for the last twenty years. It investigates the amounts of money, how it is distributed between the genders, the type of tournaments and the locations of the investments. Given that the 2019 – 2020 season was not completed due to the COVID-19 virus, it is not included in this analysis. A summary analysis of that season can be seen here PSA World Tour 2019 – 2020 Season Summary
Total Seasonal Prize Money in the Last Twenty Years
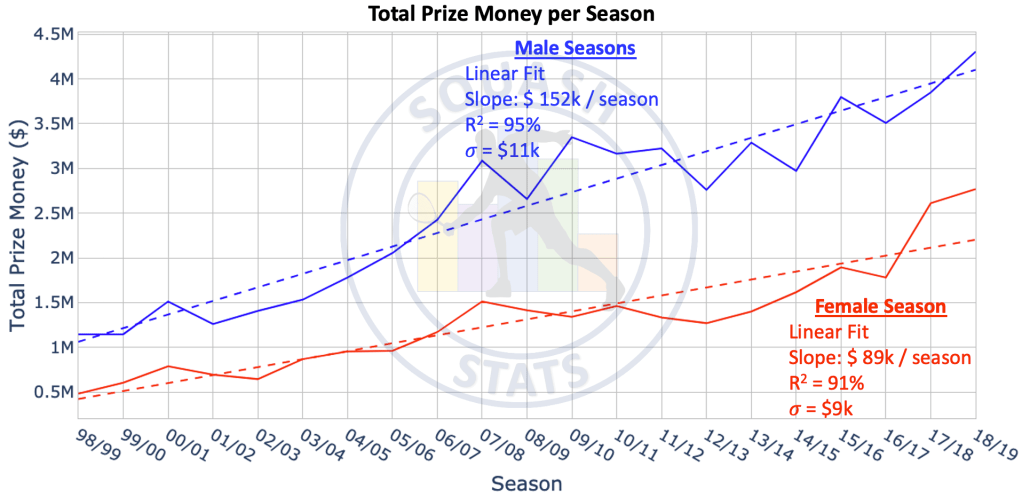
The graph below plots the total prize money of all tournaments for a given season over the last twenty years. This includes the prize money from all types of tournaments, in the PSA & WSA, for a given season throughout the last 20 years such World Tours, Challenger tours, Internationals, World Series, World Championships, Satellite Tours etc. For this analysis it is assumed that each season starts on the first of September and finishes on 31st of August. The blue lines represent the prize money for all male tournaments whereas the red lines represent all the prize money for the female tournaments. The solid lines are the actual data and the dashed lines are linear fits to the data. The r-squared value (coefficient of determination) which determines the degree to which line fits the data, for both linear plots are over 90% indicating a very good fit. As a general trend one can see that the total prize money per season increases over the years. In the 1998 – 1999 season the graph starts with a total annual prize money of $1.2M and $505k for the male and female seasons respectively. Twenty years later in the 2018 – 2019 season, the total seasonal prize money has increased to $4.4M and $2.75M for the male and female tournaments respectively.
One could claim that the annual prize money for both genders between the years 2007 and 2015, did not substantially increase and thus during this time the annual prize money stagnated. Having said that, a linear fit remains plausible and we will continue with this assumption. The slopes of the linear fitted lines (dotted lines) provides us with the average rate by which the total seasonal prize money increases. The total prize money for a male season increases at an average rate of $152k per season whereas the female receives an increase of $89k per season which is only 60% of their male counterpart. One can also see that, over the last two years, there has been a significant increase in the money provided for the female season.
In general, the rate of inflation is 2 – 3%. This percentage is relatively small compared to the rate of increase each year and thus inflation is neglected for this study.
Future Projections
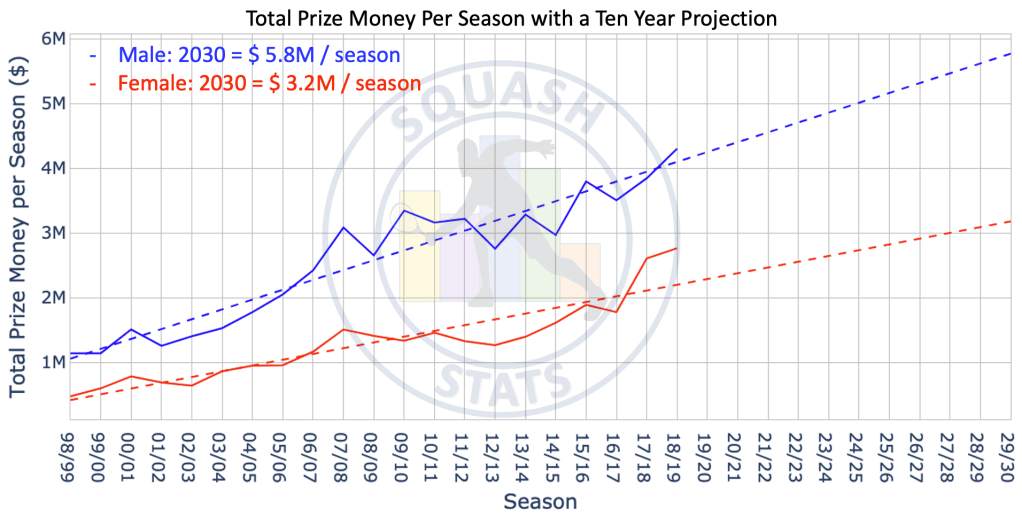
Given that the total prize money per season increases linearly with time, one can use this linearity to generate projections for the future. We therefore assume that for the foreseeable future the male and female accumulative prize money per season will increase by $152k and $89k respectively (i.e. the slope of the respective lines in the previous sections). The plot below again shows the data in the previous chart as well as an extrapolation of the linear fits for a further ten years. This predicts that for the 2029 – 2030 season there will be a total prize money of $5.8M and $3.2M for the male and female seasons respectively. However, in reality, due to world wide economic turbulence created during the COVID-19 crises, the effects on the season prize money are difficult to predict.
Given the current economic status with the COVID-19 virus spreading across the world, it is expected that it will have an effect on many industries.
Total Prize Money by Gender
As is shown above, there is a large discrepancy between the male and female total prize money investment for a given season. This however is not an indication of a gender pay gap but simply that more money is being invested in male professional squash. This may in fact be due to there being more individual male players per season than individual female players which leads to more male tournaments and thus a higher total season prize money for males. To adjust for this, one should normalize the seasonal prize money over the number of players and tournaments for that particular gender.
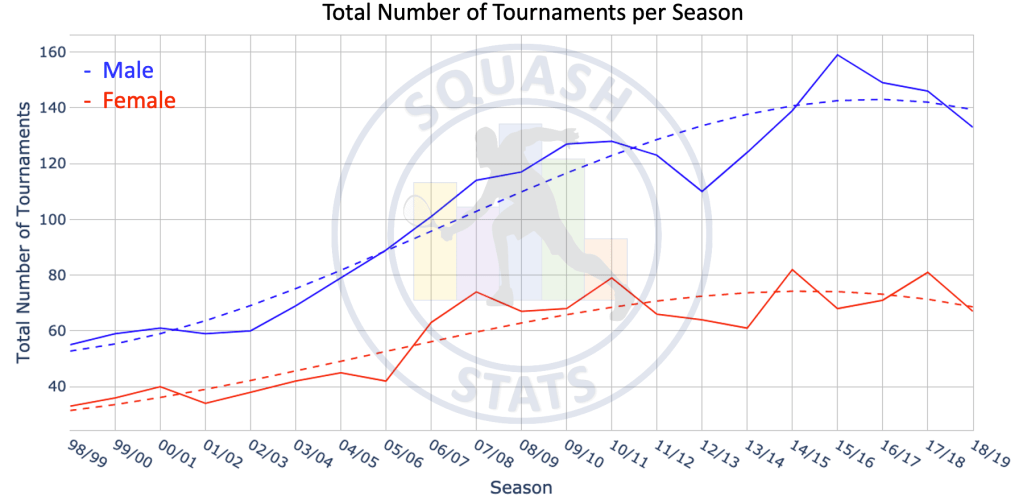
The graph below shows the increasing number of tournaments for each gender per season. It can be clearly seen that there is always a substantially larger number of male tournaments than female tournaments each season. From the 2007 – 2008 season, the number of female tournaments have remained more or less constant while the number of male tournaments continued, on average, to increase. However in more recent years (since 2015) it looks like the number of male tournaments has also started to stagnate, and even decrease. This difference in the number of tournaments per season can account for the gap in the total prize money per season.
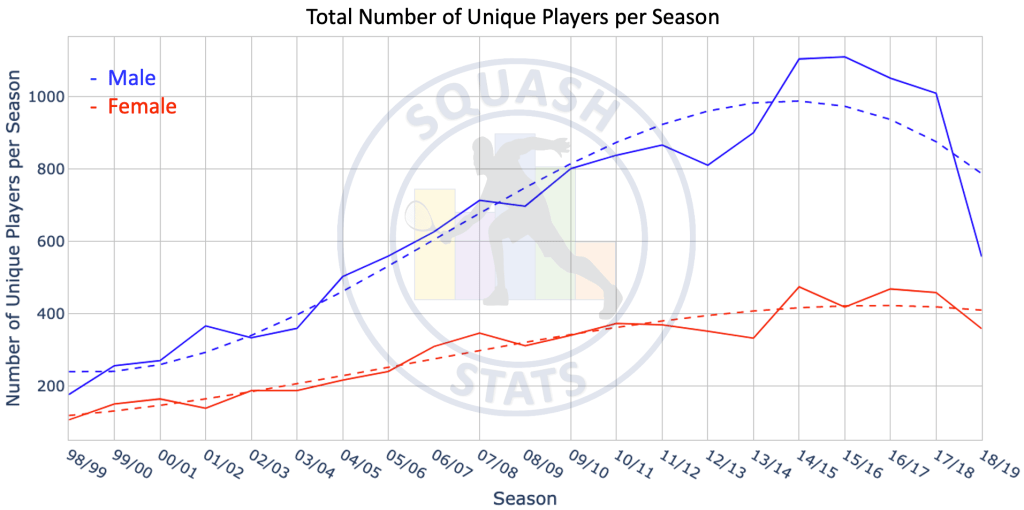
Given that there are a varying number of tournaments, it is assumed that there is also a varying number of players per season. This is illustrated below whereby the unique number of players per season follows the same trend as the number of tournaments per season (above graph). Thus as the number of players increases so too does the number of tournaments to accommodate the larger number of players and thus the prize money per season. It is worth noting that for male tournaments there is a sudden decline in the number of unique players per season decreasing from 1,000 players to 600 players over the 2018 – 2019 season. It can also be seen that this decrease in the number of unique players coincides with the decrease in the number of tournaments in the above ploy reinforcing the relationship between the number of unique players and number of tournaments.
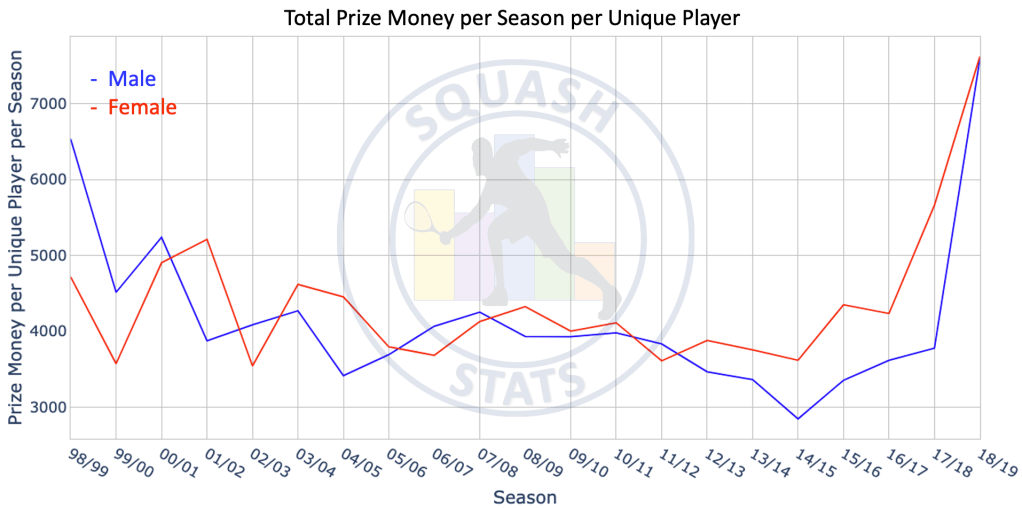
Now we can look at the total seasonal prize money provided per unique player for each gender. This should give an idea if there is infact a gender gap discrepancy. Illustrated below is the total prize money per season per unique player for both genders. The male and female lines remain pretty close to one another indicating that the total prize money per player in male and female tournaments, as a whole, have the same amount of investment. Interestingly from 1998 – 2013 there is a downward trend meaning that although the prize money is increasing (as shown in a previous graph) the number of unique players is increasing at a faster rate. The sharp reduction in unique male players in recent years mentioned in the previous paragraph results in the prize money per player to increase dramatically after 2014. Perhaps this is done on purpose to provide more money to players. This is not conclusive evidence that there is no gender pay gap in professional squash but just that the investment is equal from the point of view of the investment per player.
Variation of Tournament Types
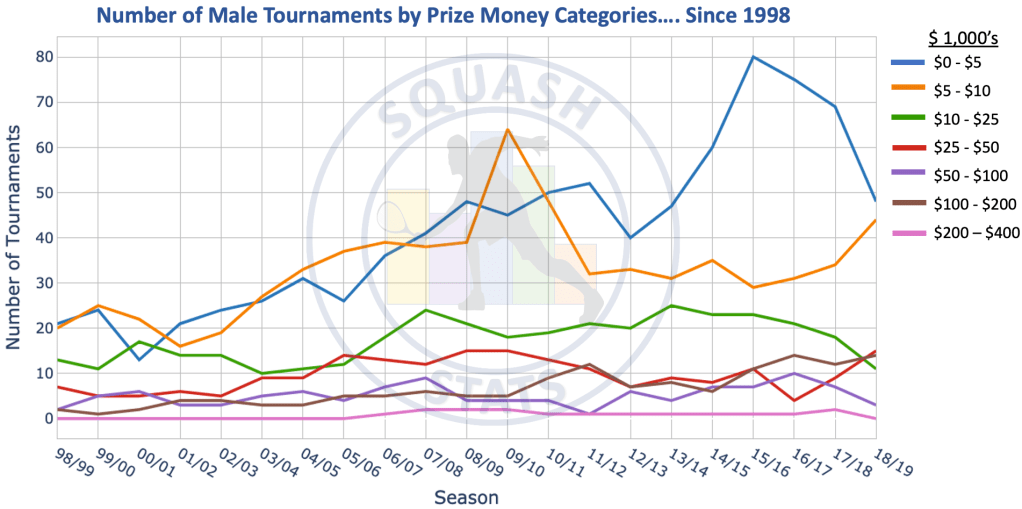
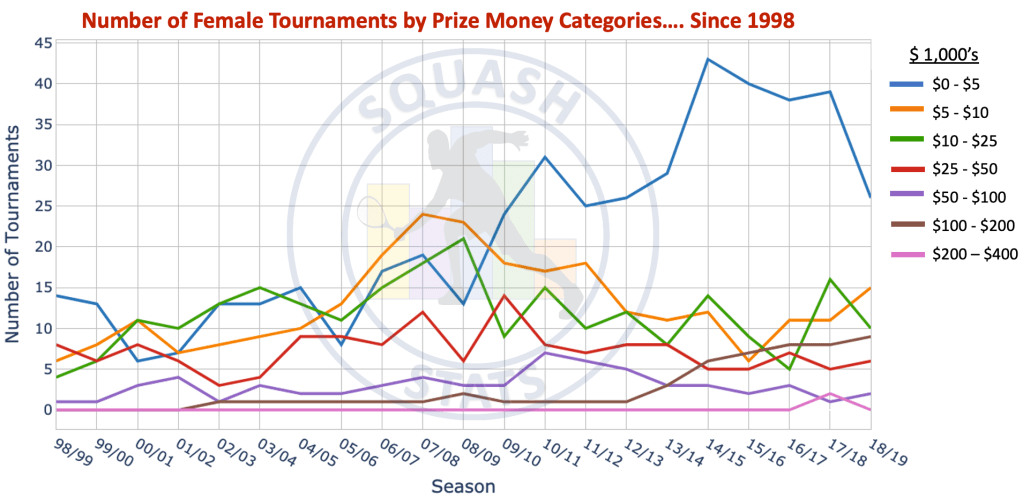
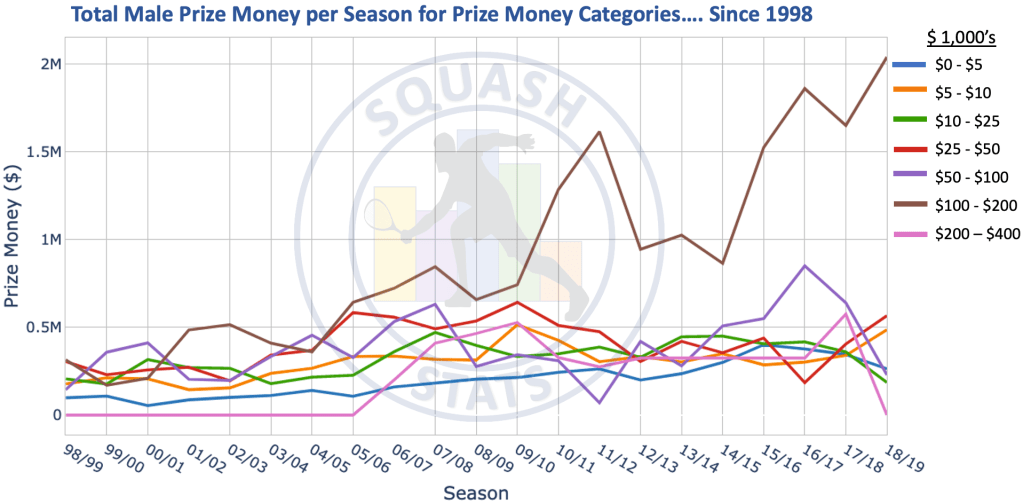
In the above sections we saw that the number of tournaments vary over time. However, it did not look into which types of tournaments varied. We can categorise tournaments in terms of their prize money and see how these categories vary over time. In general, the lower the prize money the higher the number of tournaments per season for that category. The graphs below illustrate how the number of various prize money category tournaments vary over time. It should be noted that the 5k tournaments have gradually increased their prize money over the years. For example, today most 5k tournaments will have a prize money of $6.5k. In this study we have maintained that these tournaments will still remain in the $0-$5k category, and the same rule applied to all other tournaments that are defined by their prize money (e.g. 10k tournaments, 50k tournaments etc).
Between the years 2002 – 2016, there was a substantial increase in the number of 0 – $5k tournaments. However, after this period of time these numbers have been decreasing. Since the years 2009 for male and 2012 for females the number if $100k – $200k tournaments have been increasing almost linearly.
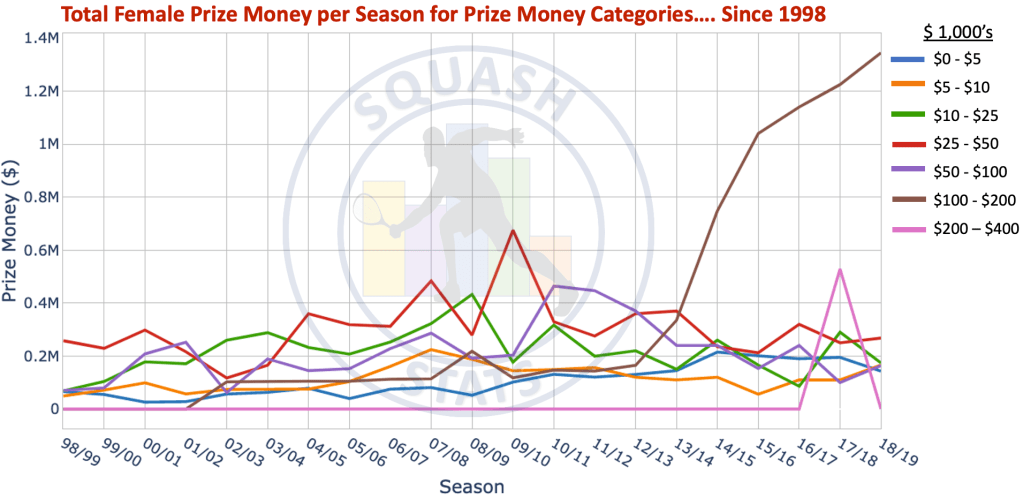
The above plots give us an understanding of the number of tournaments for each prize money category. However, it is more interesting to produce the same plot in terms of total prize money per season for a particular category. The most noticeable trend in the male tournaments is the gradual increase in investment for the $100k – $200k prize money tournaments. This increase is more pronounced in the female tournament where the increase starts in the 2013 – 2014 season, increasing year-on-year after that. By the year 2019, the prize money invested in the $100k – $200k prize money tournaments accounts for 50% of the total annual prize money provided for each gender. In other words, 50% of all the prize money for the 2019 – 2020 season went to the tournaments with a prize money in the range of $100 – $200 which only constitute 10% and 14% of the total number of tournaments for the male and female seasons respectively.
Geographical Statistics for the Prize Money
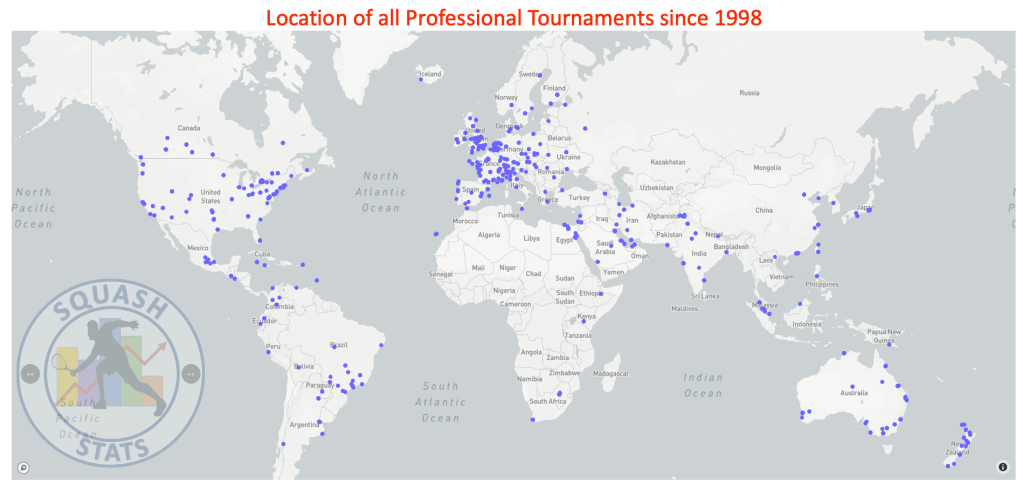
Unfortunately squash does not have the same popularity in each country and thus there are typically different tournament types in each country which leads to tournaments with varying amounts of prize money. It should be noted that the prize money provided by tournaments within a country is not related to the money invested in the sport of squash by that country but rather it is simply related to the amount of money the tournaments can draw by sponsors. The image below illustrates the location of most of the professional squash tournaments since 1998 which took place in 550 cities in 83 countries.
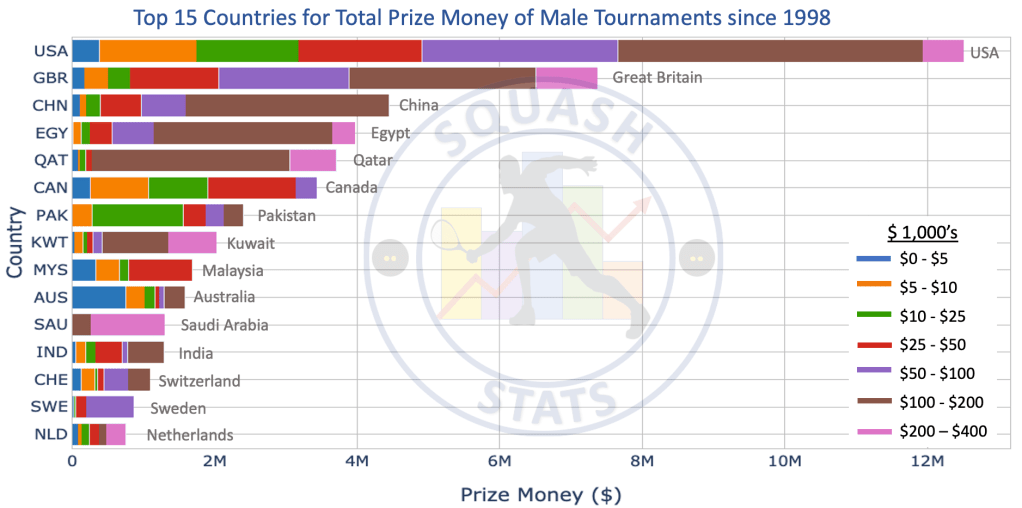
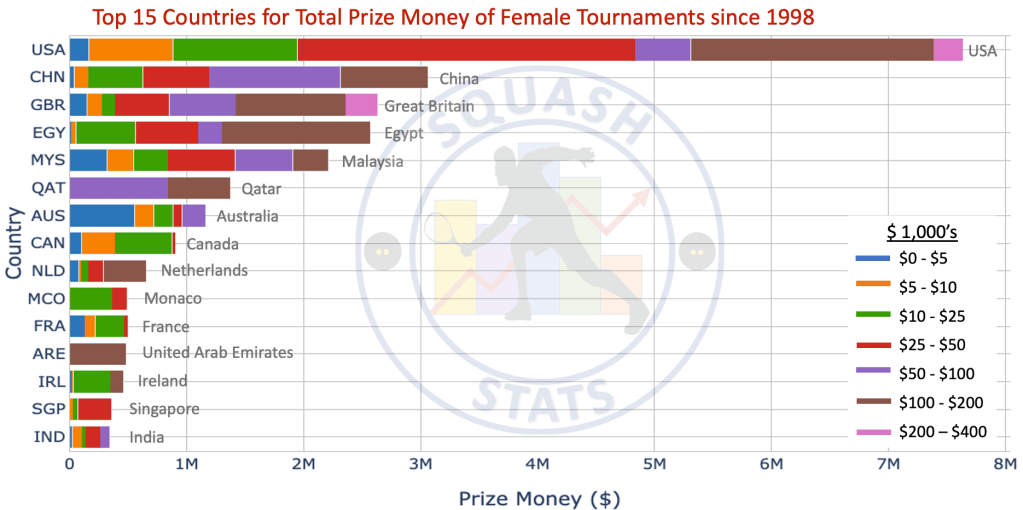
We can look at the total prize money provided for tournaments within certain countries to determine which countries have drawn the most prize money. This is plotted below for all male and female tournaments since 1998. It can be clearly seen that the USA has provided tournaments with the most prize money with a total of $12.4M for the male tournaments and $8.1M for female tournaments. The United Kingdom provides the $7M for male tournaments but only $2.5M for the female tournaments. It can also be seen that the same countries (more or less) appear for both male and female tournaments.
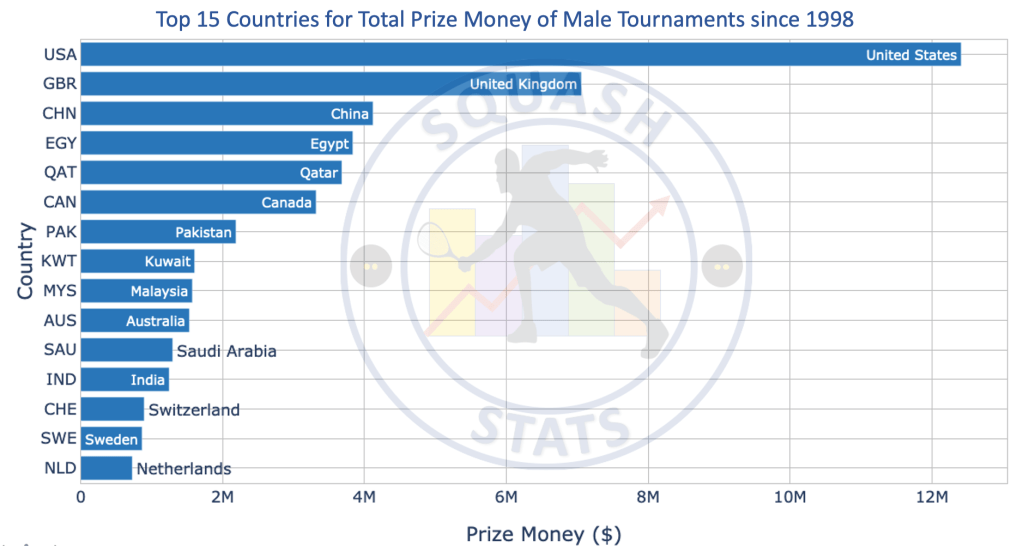
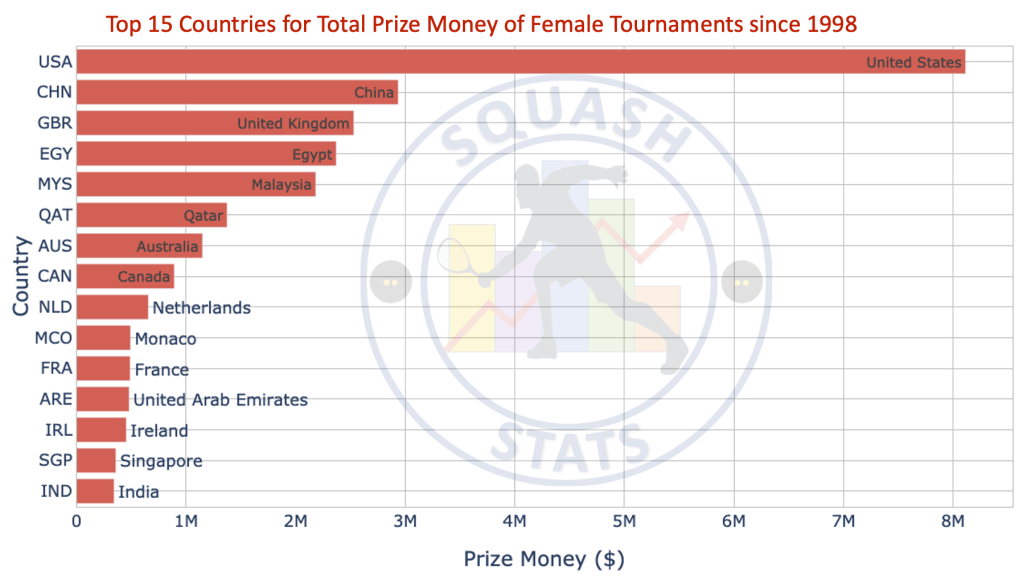
It is also interesting to see what tournament types are held in each country and how these tournament types contribute the the total prize money investment for that country. To illustrate this each bar in the above male and female bar charts is divided up into categories according to the prize money of each tournament. The top five countries have a large majority or tournaments prize money in the range of $100k – $200k. For the female prize money it can be seen that ~ 70 of all the prize money over the +20 years comes from the $25k – $50k and the $100k – $200k tournaments.
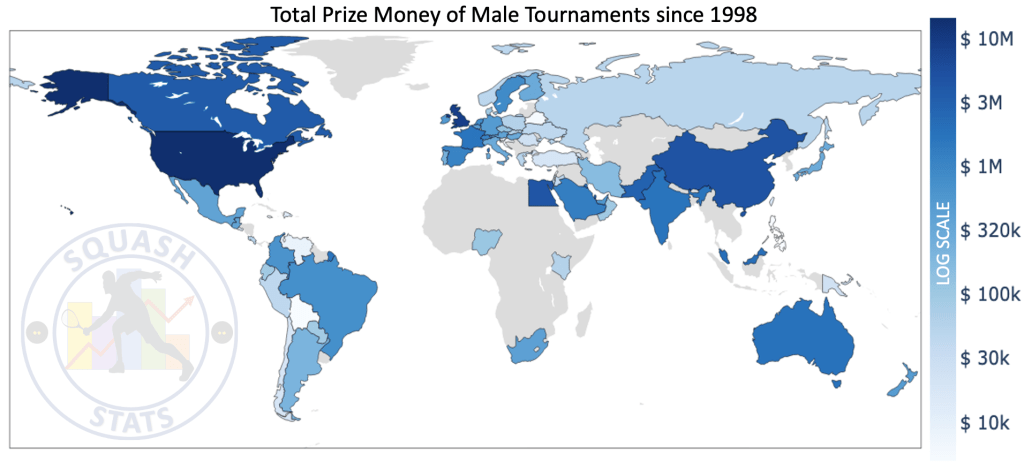
For visualization purposes, this data can also be plotted geographically as is illustrated below. Note that in order to graphically illustrate the prize money over a large range of magnitudes, the prize money colour scale is logarithmic. From examination of the male and female choropleth graphs below, the countries that invested most can be clearly seen as the countries with a darker colour.
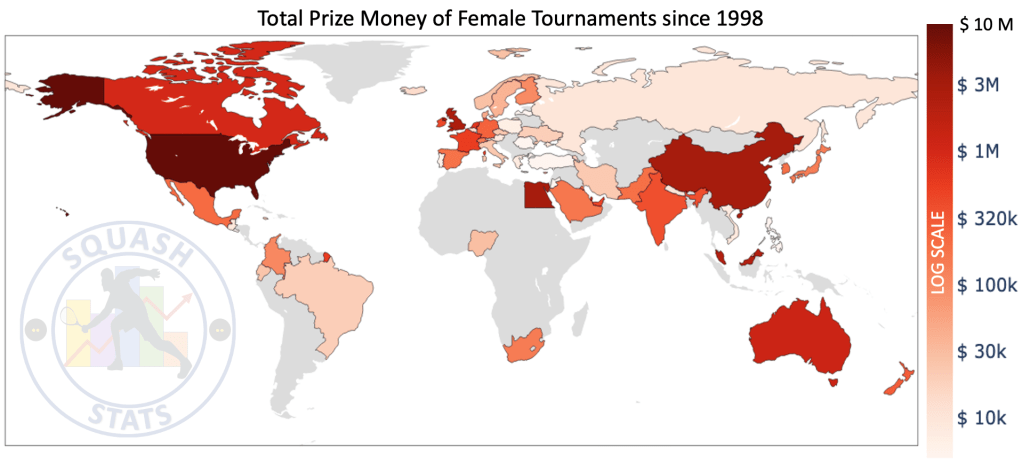
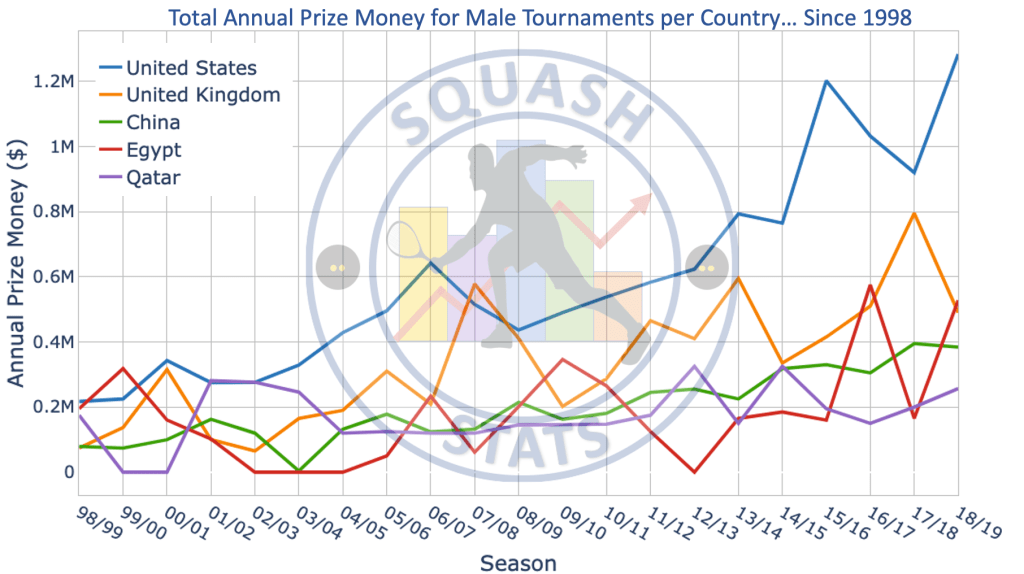
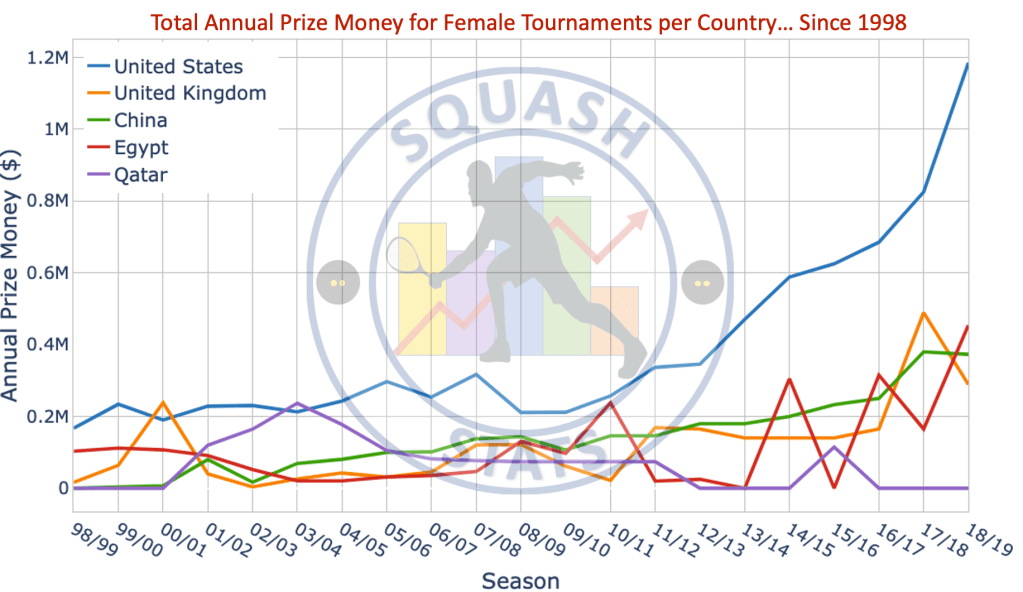
The series of graphs above clearly show that the USA and the UK clearly have the highest annual prize money for each gender. However it was not always so clear. Plotted below is the annual prize money for the top five countries. It can be seen that the total annual prize money in the USA increases dramatically over time. For the male tournaments this started in 2002 and in 2010 for the female tournaments. Despite this time lag, USA now has an equal (more or less) total annual prize money for both genders at approximately $1.2M each. It can also be seen that since 2003, the total annual prize money has been increasing almost linearly in China for both genders. In recent years, Egypt has been attracting an increasing annual prize money, also on a gender-equal footing. Qatar has remained constant in its prize money for male tournaments but since 2004 has drawn less and less annual prize money.
In the very first section of this blog it can be seen that there has always been a large disparity between the total annual prize money for male and female tournaments. However, from the graphs below it can be seen that the top 5 countries in terms of highest annual prize money have an equal split between male and female tournaments.
Outlook
This blog post investigated the total prize money every season for the last 20 years. It is encouraging to see more and more prize money being provided to professional players from all levels. Let’s hope this continues for the foreseeable future. Having said that squash still has a long way to go before reaching the prize money earned in tennis which had a total season prize money of $158.7 M in 2020. This is 21 times larger than the PSA seasonal prize money for the same time period.

just to say Michael, that these articles are much appreciated. All the best
LikeLike