


Although squash has recently been rejected once again from entry into the Olympics, it maintains its reputation as being a world-class competitive sport which attracts more and more players and fans worldwide each year. Throughout the years PSA squash has undergone several rule changes and technological advancements to Increase its global appeal as well as to increase competitiveness. The PSA tournaments have: changed the scoring system (2005 for males, and 2009 for females), decreased the tin height (2015 for females), implemented HD television coverage (SquashTV) as well as video review technology (2011), improved lighting, made court modifications, and added portable glass courts in unique locations such as Pyramids of Giza, Hong Kong Harbour, Grand Central Terminal, and the Shanghai Bund. Many of these changes have affected the duration of the matches.
In this article Squash Stats will take a look at how the match durations have varied over the last 20 years. It is difficult to define absolute relationships from match durations statistics alone, mainly due to the fact there is a large variation in durations and it depends on a lot of factors. However, in this article we provide a point of reference whereby matches can be compared to general trends. We explore the match durations in terms of gender, tournament stage, scoreline, and player rank difference. We conclude the article by taking a look at the average match durations for current and previous players.
Data Source
Note that data taken for this article has a time span from 2000 – 2020, and in the latter part of the article only data from 2018 is considered. Also in this article, only best of five (BO5) matches are considered.
As with most of our articles, the majority of the data has been taken from Squash Info – the definitive squash resource which is a regularly updated website with a large database of match results, ranking, and player profiles, match history and much more.
A Few Basic statistics
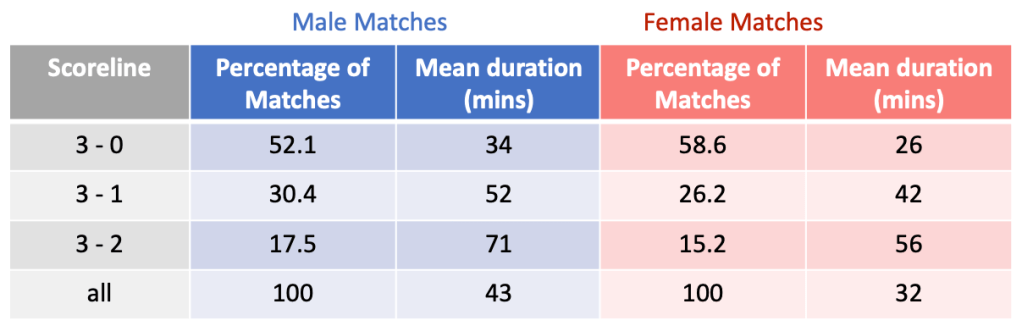
Before we take a deeper dive into the data, here are a few statistics that stand out regarding the squash match duration. The following table provides the overall average match duration for a given scoreline for male and female matches. For example the average duration of a 3-2 scoreline is 71 minutes for male matches and 56 minutes for female matches. The table also provides the percentage of matches that has that scoreline. As an example, for the aforementioned scoreline 3-2, ~52% of male matches and ~59% of female matches end with this scoreline.
Longest Male Match:
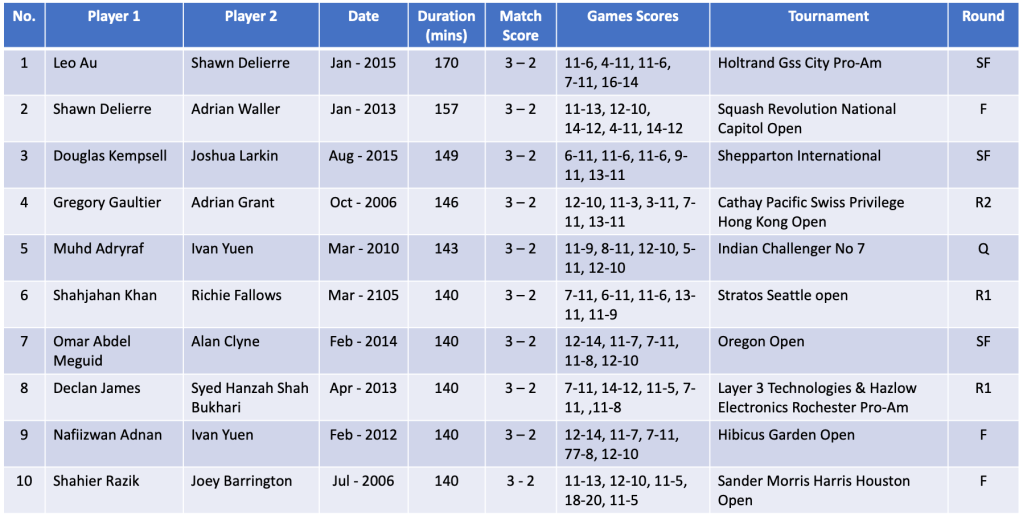
The longest male PSA match ever was between Leo Au (PSA rank 33 as of Jan 2015), from Hong Kong, and Canadian Shawn Delierre (PSA rank 54 as of Jan 2015) who battled for 2 hours 50 minutes (170 mins) in the semi-finals of the Squash Revolution National Capital Open in Alberta, Canada. Leo Au won the match on 22/1/2015 with a score of 3:2 (11-6, 4-11, 11-6, 7-11,16-14). To read more about the match see the following PSA article and The Squash Site article.
Longest Male Final Match:
The longest male PSA Final match ever was between Adrian Waller (PSA rank 38 as of Jan 2013), from England, and Shawn Delierre (PSA rank 39 as of Jan 2013) from Canada who battled for 2 hours 37 minutes (157 mins) in the final of the Squash Revolution National Capital Open in the USA. Shawn Delierre won the match on 9/1/2013 with a score of 3:2 (11-13, 12-10, 14-12, 4-11, 14-12). to read more about this game please read the Time Colonist article
Longest Female Match:
The longest female PSA match ever was between Samantha Teran (PSA rank 22 as of Jan 2008) of Mexico, and Lataasha Khan (PSA rank 24 as of Jan 2008) of the USA who battled for 2 hours (120 mins) in the finals of the Liberty Bell Open in Philadelphia, USA. Samantha Teran won the match on 22/1/2008 with a score of 3:2 (9-1,10-9, 4-9, 6-9, 9-6).
Given that the longest female match was a final, this also fulfills the longest female final category.
Top 10 Longest Matches
The following tables provide information on the top 10 longest matches in for both gender in the 2000 – 2020 time period:

Initial Exploration of Match Duration Data
Clearly there can be a large range of match durations which will depend on the competitiveness of the matches. There will be fewer very long and very short matches, and most games will lie somewhere in the middle. Thus the match durations can be described as a distribution whose shape can be statistically described in terms of mean, mode and standard deviation.
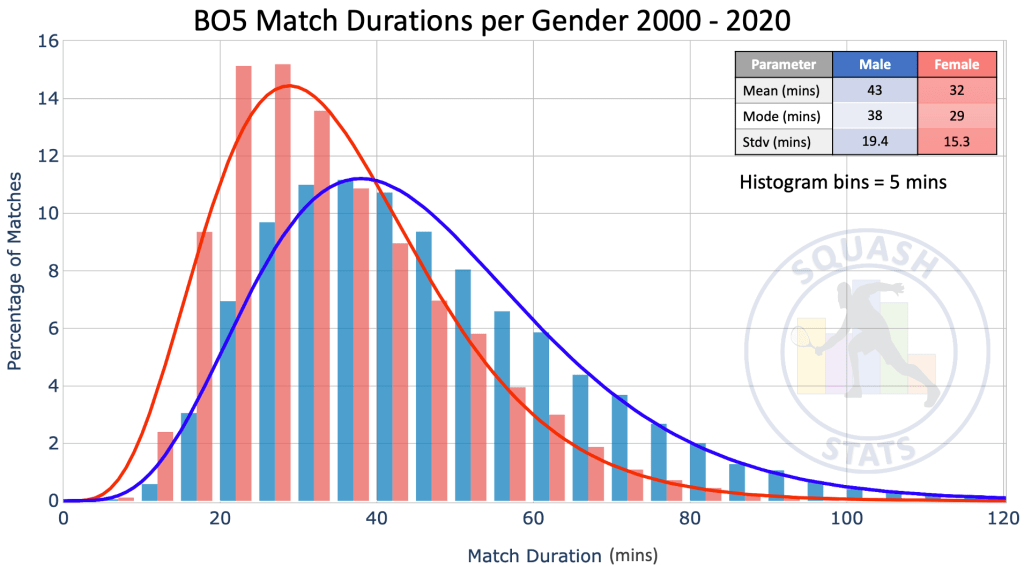
The bar chart below illustrates the distribution of all the male and females PSA matches between 2000 – 2020 which are plotted in blue and red respectively. The percentage of matches per gender is indicated on the y-axis and the match duration in minutes is indicated on the x-axis. This histogram is plotted with a bin-size of five minutes which means that each bar represents a five minute period of time. For example, the plot below indicates 11% of male matches are between 40 – 45 minutes in duration. Each data set is fitted with a gamma distribution which is indicated by the full red and blue curves.
From the plot below It can be immediately seen that the male (blue) curve is shifted to the right when compared to the female (red) curve. This simply means that on average male matches are longer in duration than female matches. The basic statistics which describe the distribution curve are also given in the top right hand corner of the plot. It can be seen from this table that all the male values are larger than their female counterpart. The average (mean) male match is 43 minutes and the average (mean) female match is 32 minutes. The mode statistics represents the most common occurring match duration, which is 38 minutes for males matches and 29 minutes for females matches.
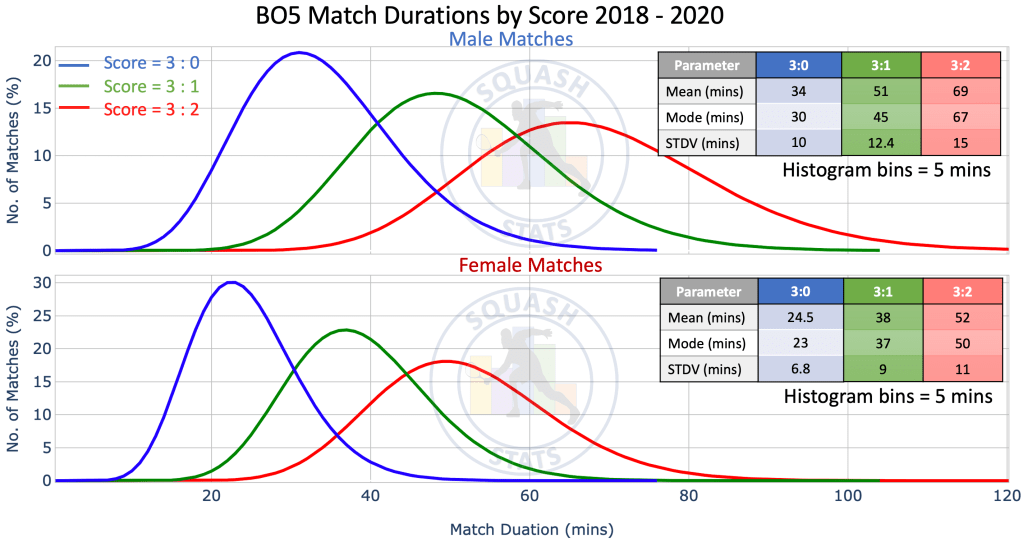
The above plot of course is composed of all PSA matches from 2000 through 2020, including all PSA tournament levels, and at all stages of the tournaments. Intuitively, one can say the matches duration can be determined by the closeness in the quality of the players and thus the number of games in the match. The above plot can therefore be categorized into matches of different scorelines i.e. 3-0, 3-1, 3-2. These plots are shown below for both male (upper) and female (lower) matches where each scoreline is illustrated by a different colour which is indicated in the legend.
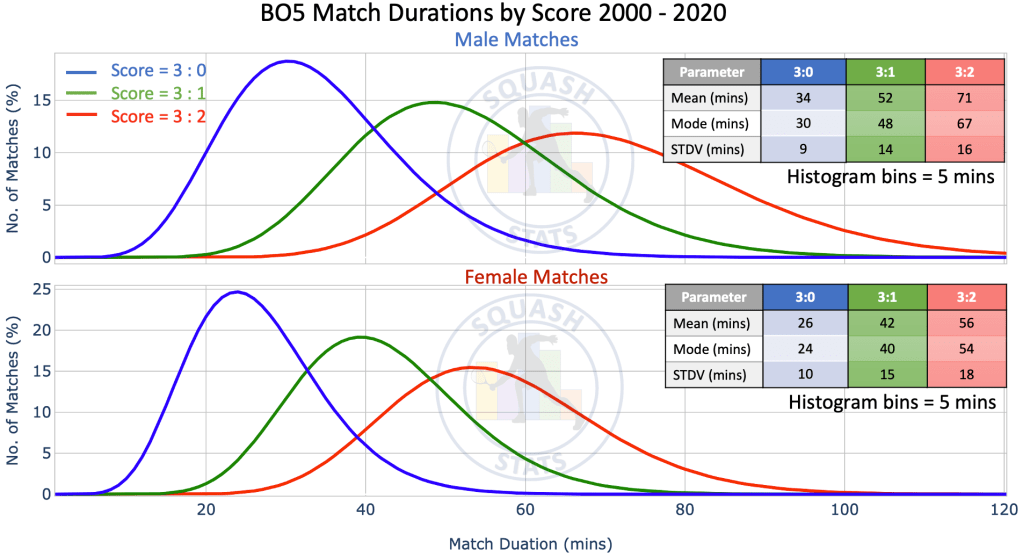
For purposes of presentation and aesthetics the actual bar-charts are not shown but rather the gamma distribution fitted to the data is illustrated. The chart is once again plotted in bins of five minutes meaning that the percentage of matches should be read (and averaged) in 5 minute intervals. The above plot can thus be read as follows: 14% (y-axis value) of all male matches that result in a score of 3-0 (blue plot) have a duration of 35 – 40 minutes (x-axis value), whereby 14% is the average percentage between these match durations (x-axis). For female matches of the same time duration (35 – 40 mins) only 8% of matches conclude with a scoreline of 3 – 0.
For a given gender it can be seen that the gamma distribution is shifted to the right as the number of games increases indicating that the average match duration increases with the number of games, which is very intuitive. However, for example there are still some 3 – 0 scoreline matches that are longer than 3 -2 scoreline matches. The statistics of each scoreline per gender is provided at the top right hand corner of each subplot. The mean match duration for each score line per gender can be read from the ‘mean (mins)’ row in the statistics tables in the above plot. Again it can be seen both visually from the plots and numerically from the statistics that for a given scoreline, the male matches are longer on average with respect to the female matches. For example for a scoreline of 3 – 2 the average male match is 71 minutes long and the average female match with the same scoreline is 56 mins.
The fact that the amplitude of the peaks decreases as the number of games per match increases is simply an indication that the spread of match durations is increasing with increasing average time duration. This is also shown numerically whereby the standard deviation, which is related to the spread, increases as the number of games per match increases.
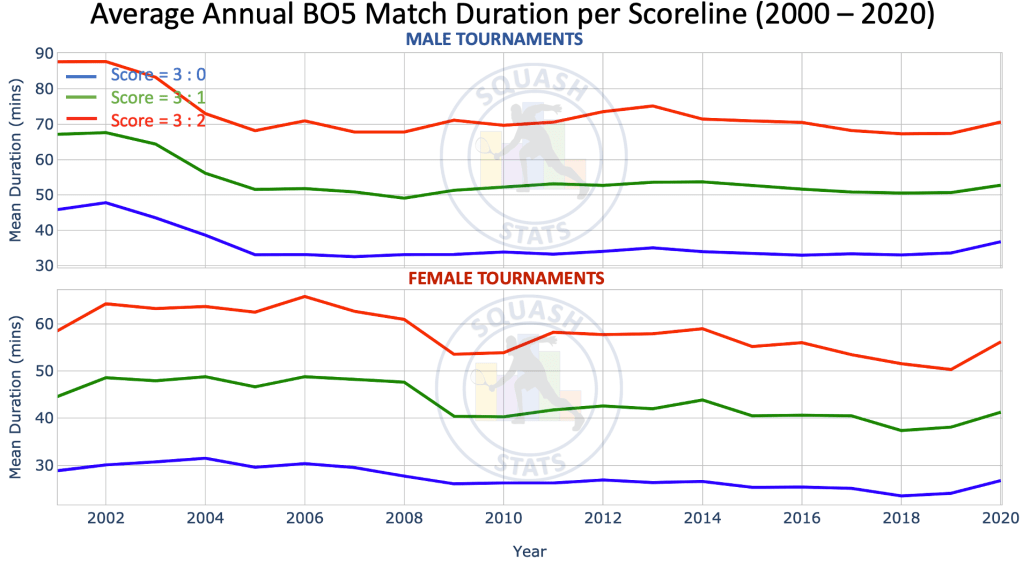
Using this technique to categorize the matches by their scorelines, we can also look at the mean match duration for each gender annually. The plot below shows the average match duration for all matches in a given year per scoreline for each gender. It can be seen that during 2000 – 2005 the duration of the average male matches decreased in length. This happened proportionally for all scorelines indicating that it may have been due to a change in the game rules. This is most likely due to the implementation of the PAR scoring system in 2000. However, since 2005, male match durations have remained reasonably constant.
For the female matches the duration remains somewhat constant from 2002 – 2006 after which there is a substantial drop in the match duration starting in 2009. After a slight increase in 2011 the match duration remains consistent until 2014 after which point the match duration decreases regularly. This regular decrease in match duration coincides with the implementation of lowering the tin height for female players.
Match Durations in Recent History
The above analysis provides an insight into how the match duration behaves annually over the last 20 years. However, during this 20 year there have been many changes in the game, the rules, the league structure, the refereeing which can all have an effect on the match duration. In order to try to isolate a consistent range of data with as little as rule/game changes as possible, from now on we will only consider data from 2018, which was when the PSA implemented the World Tour & Challenger tournament formats.
The following are the statistics of the aforementioned data-set (2018 – 2020) which is split into three categories: the World Tour and Challenger Tour combined; only the World Tour matches; and only the Challenger Tour matches.
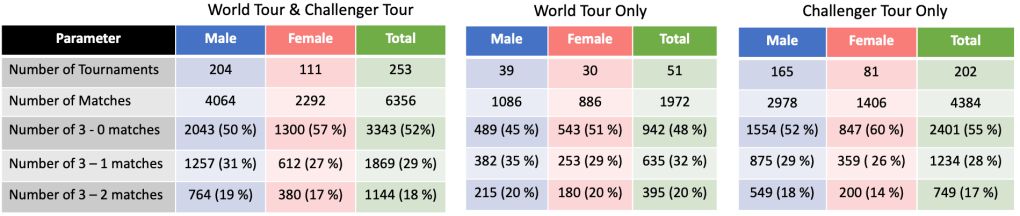
The tables above provide the number of tournaments, matches and matches per scoreline for each tournament type (World Tour or Challenger Tour) per gender. It can be seen that the percentage of matches (note: the percentages are per for a particular gender) per scoreline are in the same range, although not exactly the same, for both the World Tour and Challenger Tour. This is also shown in the bar chart below which illustrates the percentage of matches per scoreline for each gender (male: blue shaded background, female: red shaded background) and each tournament grade (World Tour and Challenger Tour). In this bar-chart the scoreline is plotted in the x-axis for each gender and the y-axis represents the percentage of matches for that scoreline. For example, for the furthest left group one can determine that 50% of all male matches, 45% of World Tour male matches and 52% of Challenger Tour male matches result in a score of 3 – 0.
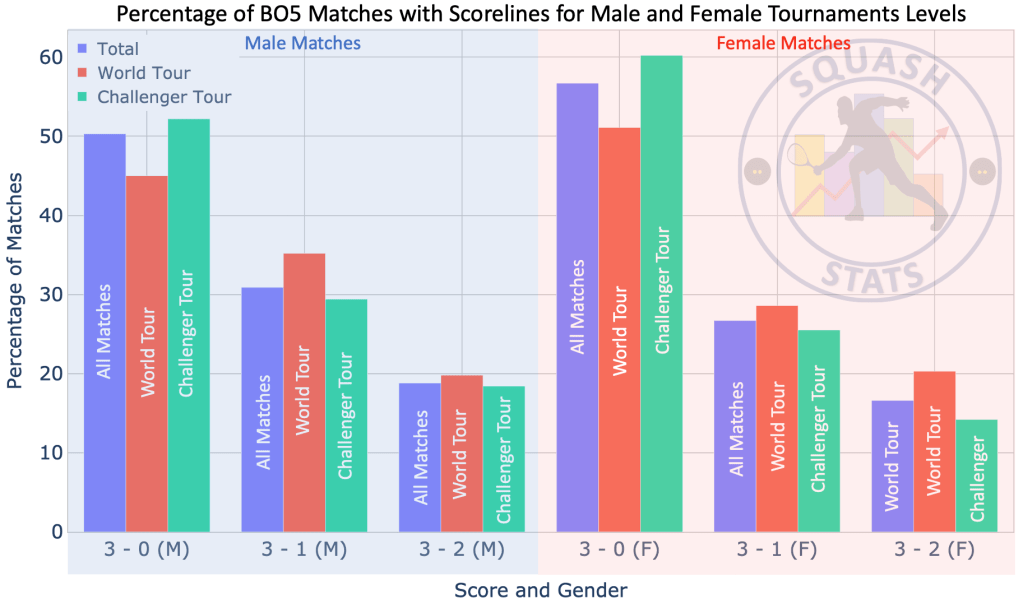
It can be clearly seen from the above bar-chart that for both genders and for both the World Tour and Challenger Tour matches, the percentage of matches decreases with increasing number of games (3-0 -> 3-1 -> 3-2). We can say, on average ~55% of matches end with a score of 3 – 0, ~30% of matches end with a score of 3 – 1, and ~20% of matches end with a score of 3 – 2. This is most likely due to the format of the tournaments whereby the games in the early stages of the tournaments often have a larger PSA ranking gap between the players and thus have a much higher percentage of 3 – 0 and 3 – 1 scores. this can have a large effect on the average match duration of the genders. for example the that there is a larger number of 3-0 scoreline matches (50 – 55%) and we know from previous plots in this article that these matches tend to be shorter in duration, this will decrease the match duration average.
NOTE: For further analysis we will not separate the Word Tour matches from the Challenger Tour matches, but rather analyze them all together. This will also prevent the sample size from becoming too small to derive statistically viable trends.
The process of aggregating the matches by scoreline was repeated for the smaller data set from 2018 – 2020. The statistics turns out to be very similar to that of the larger data set (2000 – 2020) but all the values slightly lower indicating that matches have gotten shorter which agrees with previous results. The main statistical results are again indicated in the subplot tables in the top-right corner of each subplot.
Match Duration by Tournament Stage
One can also make a similar analysis by splitting the matches according to tournament stages, i.e. finals (F), semi-finals (SF), quarter-finals (QF) and last16 (L16). The following plot illustrates the match duration distribution for the various stages of tournaments. Both from the plots and the statistics provided in the tables it can be seen that the match duration increases on average as one progresses in the tournaments for both male and female matches.
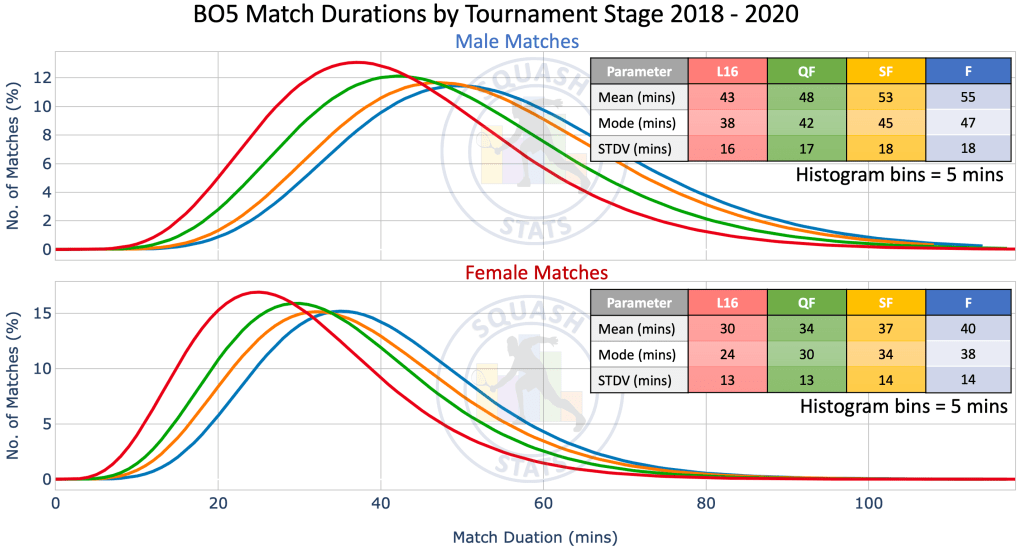
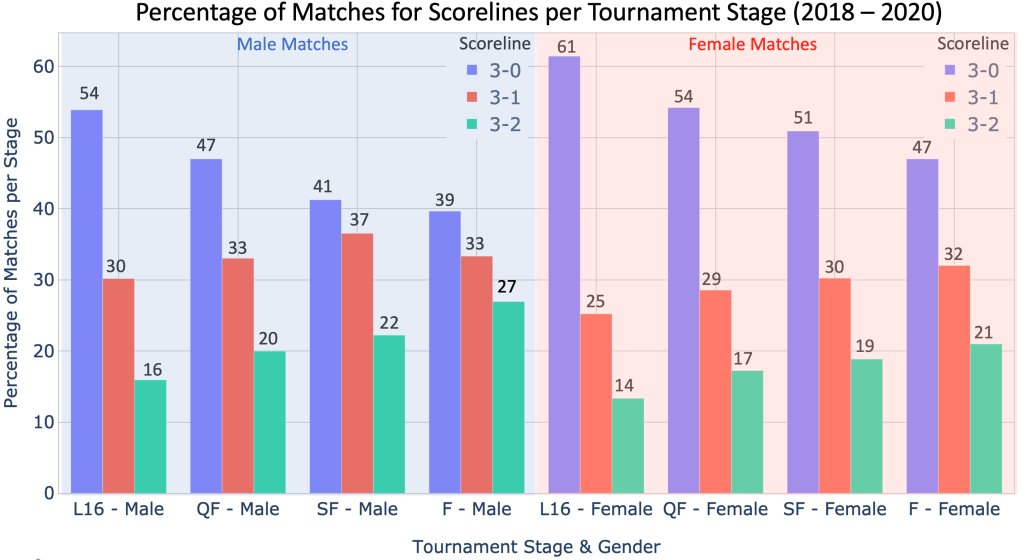
The above effect is explained by the fact that earlier stages will have matches whereby there is a larger PSA rank difference between players and thus result in shorter matches. This effect is verified by the following bar-chart where one can see that early stage matches have more 3 – 0 matches (54% for males and 60% for females) which we have already deduced are on average shorter. Similar to a previous plot, this below plot is split vertically with male matches on the left with a blue shaded background and female matches on the right with a red shaded background. The tournament stage for each gender is provided on the x-axis and the percentage of matches is provided on the y-axis. The coloured bars in each group represent the different scorelines which are indicated by the legend. For example for the furthest left group of bars one can determine that 54% of matches in the last 16 stage (L16) end with a scoreline of 3-0, 30% with a scoreline of 3-1, and 16% with a scoreline of 3-2. As one progresses towards the final, in general the percentage of 3-1 and 3-2 scorelines increase and the 3-0 scorelines decreases. This this increases the average match durations and one progresses from the last 16 (L16) to the final (F).
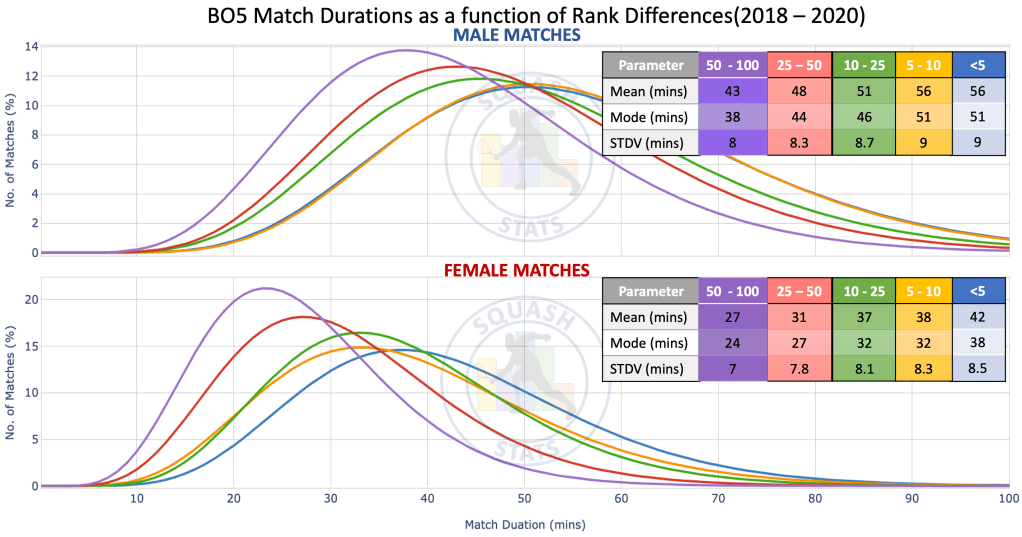
Match Duration by Player Rank Difference
In the above section it is assumed that the increasing match duration is due to the fact that players as one progresses through a tournament, players of more equal rankings are competing against each other, leading to more competitive matches and thus with a longer duration. The plots below reinforce this fact where matches with various rank differences between players are plotted for each gender. The matches were split into categories which represents a range of rank differences between the players, which are indicated in the table headings. For example, the blue line has the longest mean match duration of 56 minutes for male matches and 42 minutes for female matches which was calculated from all matches where the difference in rank was less than 5. The green line was made up of matches where the rank difference between the players was between 10 and 25, with a mean of 51 minutes for male matches and 37 minutes for females matches. In general one can conclude that the average match duration increases as the ranking difference between the player decreases. However for matches where the rank difference is less than ten, there is very little difference in the average match durations.
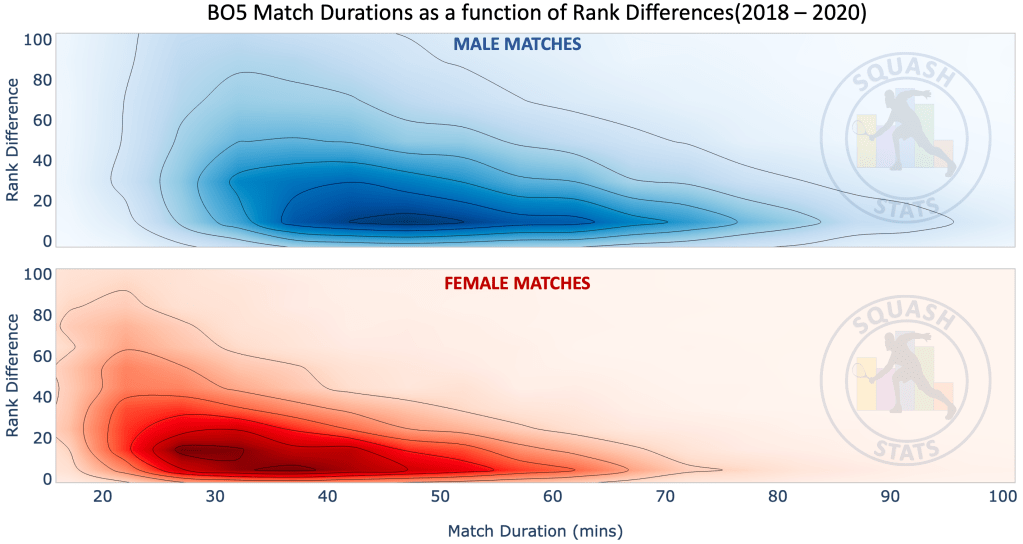
It is also interesting to make a density plot of the match durations versus the rank difference of players. The higher the colour intensity the more games that were players at that match duration and rank difference. For example, most male matches are players with a rank difference of less than 20 with match durations of 42 – 53 minutes.
Match Duration for Male Players
The data analysed in this section will also be from 2018 to 2020 as was previously explained. This allows us to examine the duration of matches over a shorter period of time where their ranking is more constant compared to their lifetime match duration.
Let’s first take a look at the male players with the longest average matches durations. This is provided in the table below where the number of matches (total matches, number of matches won, and number of matches lost) is provided, as well as the average match durations (average duration of all matches, average duration of matches won and average duration of matches lost). In this particular table, players with a total of less than 20 matches were excluded. It is not so surprising to see Joel Makin top the list with his incredible on-court physicality and work ethic. Miguel Rodriguez and Paul Coll also make the list and are also well known for their fitness and strength.
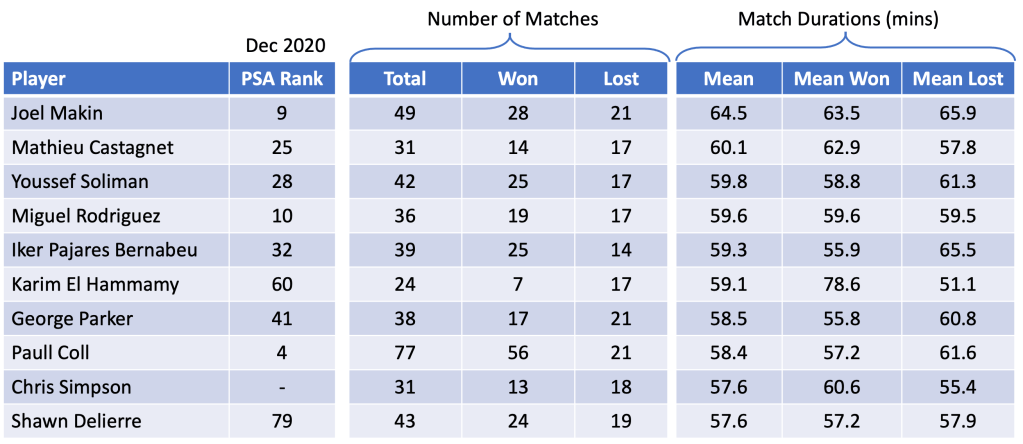
Let’s now take a closer look at the mean match duration for matches won (‘Mean Won’) and matches lost (‘Mean Lost’). It can be seen that some players have a similar match duration for matches won and lost (e.g. Miguel Rodriguez, Shawn Delierre). These players in general will have long matches whether they win or lose.
To obtain a visual representation for the difference in the matches duration for matches won and lost, the durations were plotted on the y- and x-axis respectively in the plot below. Each dot therefore represents a player’s average match durations and the solid blue line represents the match durations when the average duration for matches won and lost are the same.
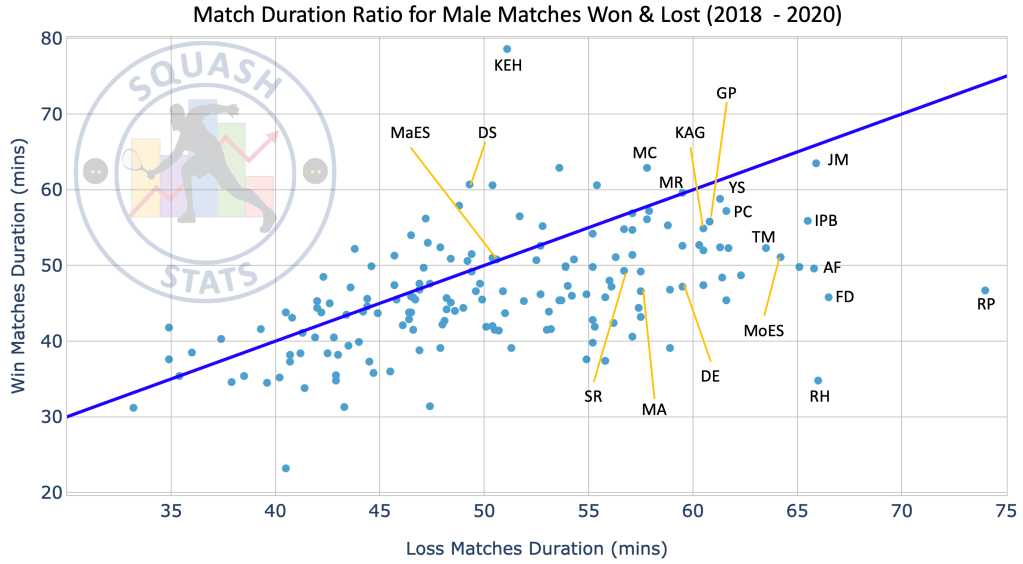
AF: Ali Farag, DE: Diego Elias, DS: Daryl Shelby, IPB: Iker Pajares Bernabeu, FD: Fares Dessouky, KAG: Karim Abdel Gawad, MA: M: Joel Makin, Mohamed Abouelghar, MaES: Marwan El Shorbagy, MC: Mathieu Castagnet, MR; Miguel Rodrigue, MoES: Mohamed El Shorbagy, RH: Rex hendrix, PC: Paul Coll, SR: Simon Rosner, RP: Rebertino Pezzola, T.M: Tarek Momen, YS: Youssef Soliman
The higher a point is on the graph, the longer the average match duration for matches won and the further a point is to the right the longer the average match duration for matches lost. It can be immediately seen that the majority of players lie below the solid blue lines. This means that on average the matches they lose are longer than the matches they win. This can due to many players winning a large percentage of matches easily in a shorter time reducing the mean duration for the matches won.
If we take Ali Farag (AF) as an example. He is one of the farthest to the right meaning that the matches he loses are very long and thus very closely contested. Mohamed El Shorbagy (MoES), Tarek Momen (TM), Fares Dessouky (FD) and similar to Ali Farag in this respect. Ali Farag is also very far vertically from the solid blue line indicating that the matches he wins, he wins much more quickly than the matches he loses. If this is compared to Joel Makin (JM) who is on the same vertical alignment meaning the matches they lose are approximately the same durations. However, given that Joel Makin is much higher up in the plot, the matches he wins are much longer and more closely contested than Ali Farag’s. This indicates that in general Ali Farag is much faster at winning matches than Joel Makin. This was found to be true especially in early stages of the tournament. In fact for Joel Makin there is not much of a difference between win and loss matches in terms of match durations.
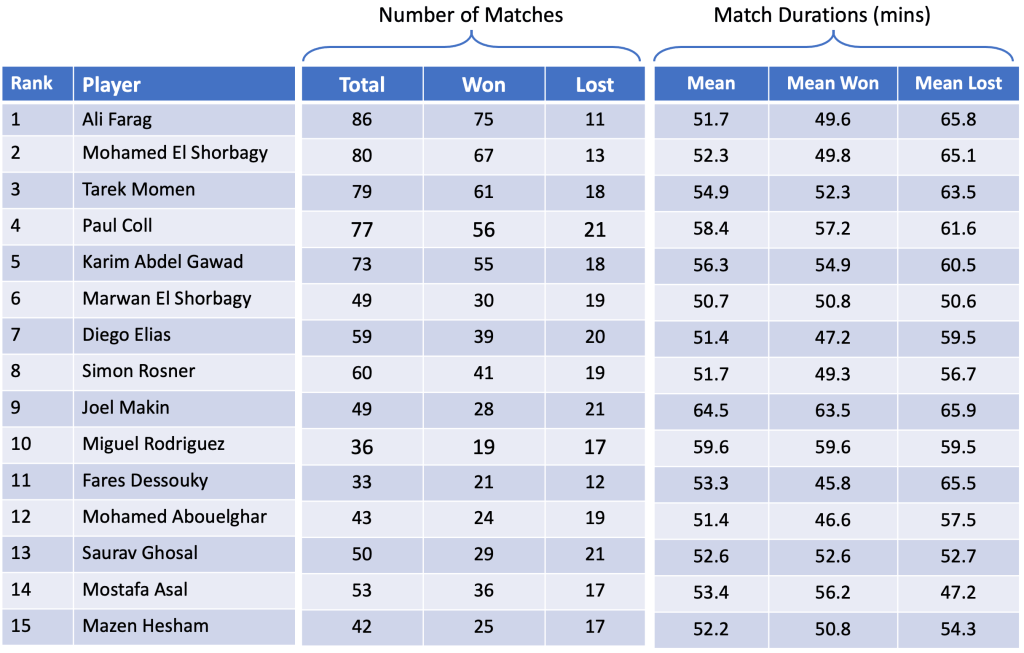
The following table provides the data for the current (Dec 2020) top 15 players whereby there can be compared manually.
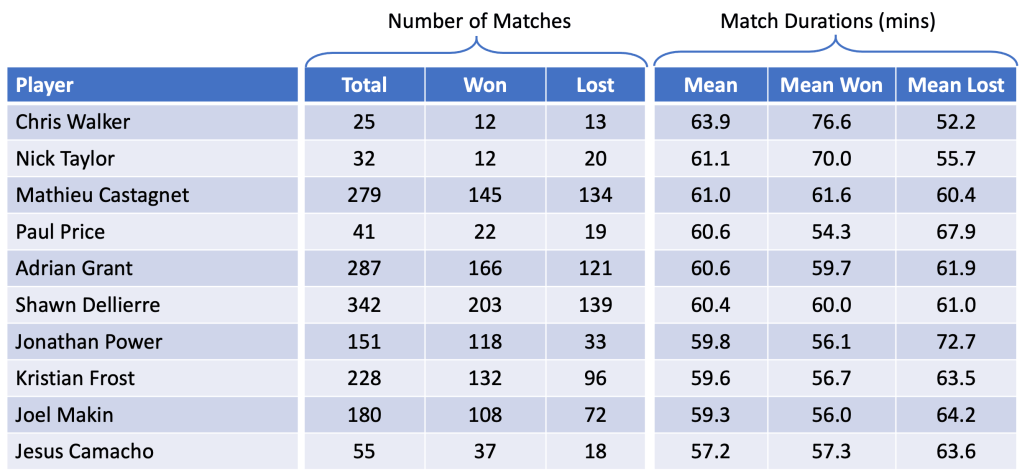
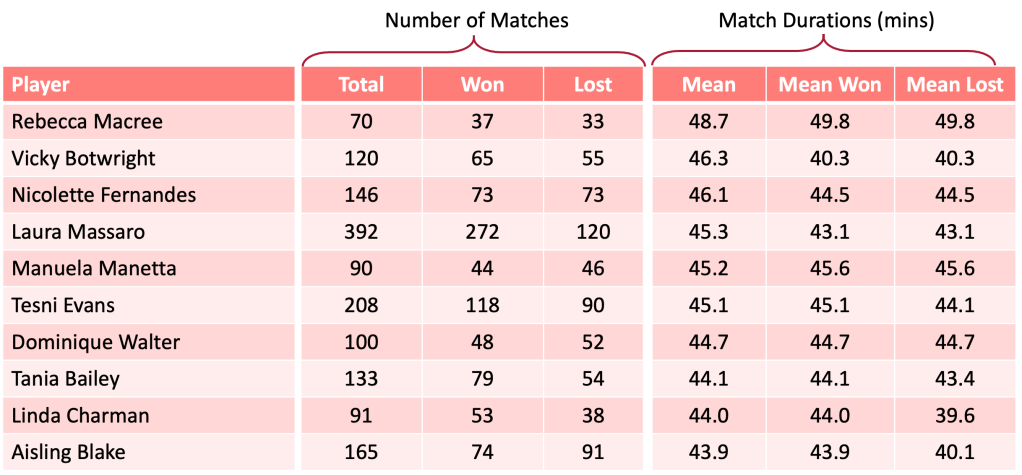
We learned earlier, the match durations have been decreasing over time. Thus the table below, provides the average match durations from 2000 – 2020, which have many players with longer matches on average.
Match Duration for Female Players
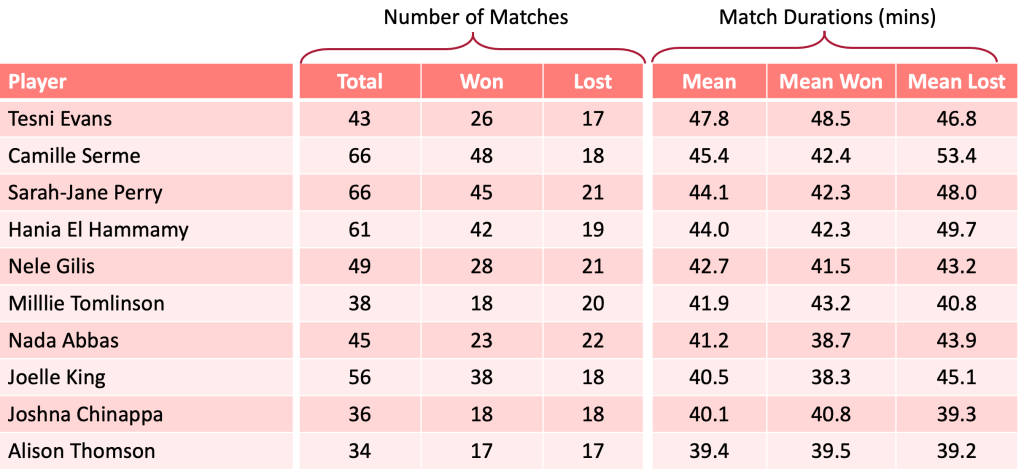
The table below is of the same format as those for the males above and is ranked in order of longest mean match duration. Topping the table is Tesni Evans with the longest match durations:
As with the male players we can plot the ratio of matches durations won and lost which is illustrated in the plot below. As with the male players it can be seen that the majority of female players lie below the solid line indicating that on average the matches they lose are longer than the matches they win. This can again be due to many players winning a large percentage of matches easily in a shorter time.
Of particular note in this plot are Camille Serme (CS), Raneem El Welily (REW) and Nour El Sherbini (NS) who are very far to the right of the graph indicating that any match they lose is a longer match.
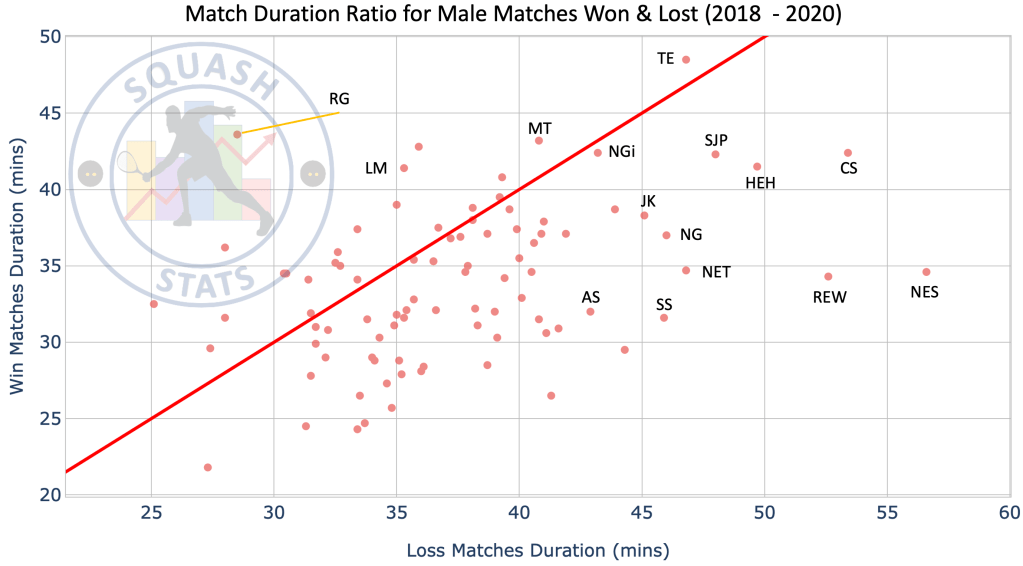
AS: Amanda Sobhy, HEH: Hania EL Hammamy, JK: Joelle King, LM: Laura Massaro, MT: Millie Tomlinson, NES: Nour El Sherbini, NET: Nour El Tayeb, NGi: Nele Gilis, NG: Nouran Gohar, RG: Rachael Grinham, REW: Raneem El Welily, SJP: Sarah-Jane Perry, SS: Sabrina Sobhy, TE: Tesni Evans
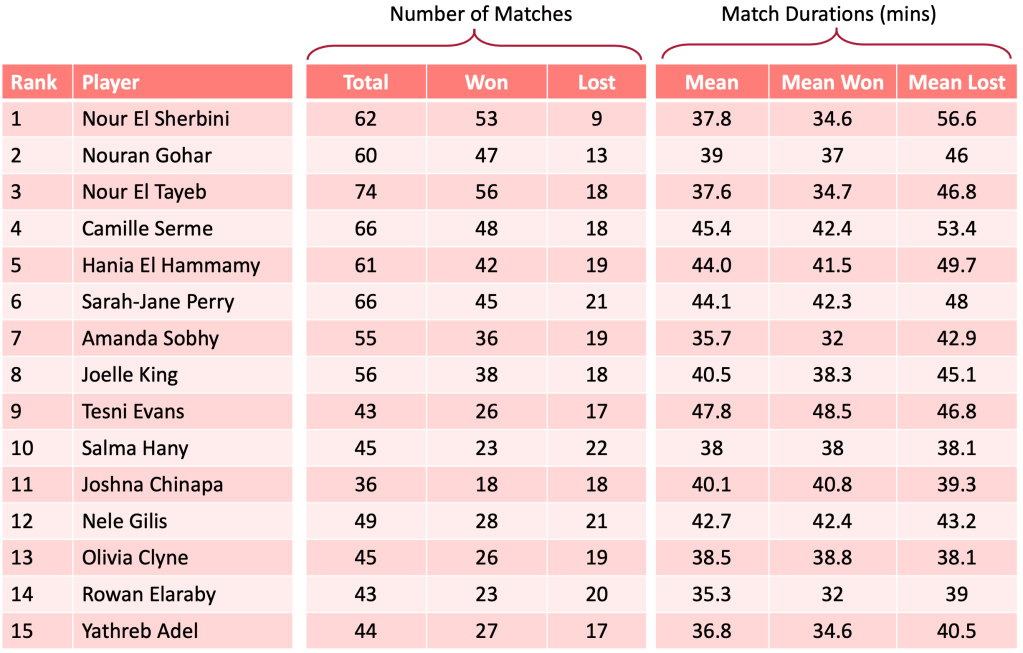
The following table provides the same data for the top 15 players as of Dec 2020:
Outlook
It is difficult to extract concrete conclusions from match durations statistics alone, mainly due to the fact there is a large variation and it depends on a lot of factors: the gender of the players, the stage of the tournament, and the rank difference between the players. However, this study provides a point of reference whereby matches can be compared to general trends. For example, if you watch a male fine that was 60 minutes long you can tell that this watch was slightly longer than average, but not by much (average male final is). It can also be an indication of competitiveness that perhaps the scoreline does not fully convey. For example if you watch a female match that ended in a 3-0 score but lasted 35 minutes, one can conclude that although the scoreline indicates a one-way dominance, the match duration is much larger than the average 3 – 0 scoreline (24.5 minutes) indicating it was more competitive.
Many of the plots in this article provide numbers and statistics for relationships that were already known or are intuitive to most people. For example, it is intuitive to think that matches with higher scoring games have longer durations. However, what is not so obvious by how much they vary, which is indicated in this article.
Most squash matches in the PSA tournament are of a best of 5 (BO5) format whereby the first player to reach 3 games wins the match. However, in recent years some tournaments have switched to a BO3 format for the earlier. One of the main reasons for this change is that it increases the intensity of the game: every point & game is valuable and thus more competitive, which in turn results in no games being tactically forfeited. Another advantage of the BO3 format is that players suffer less fatigue due to a large number of games in a short period of time which often leads to less competitive matches, or at least players not performing at their peak, in the latter stages of the tournament. In a future blog this will be investigated

Hi,
You may not be aware, however, (for your records) Rhonda Thorne (Aus) and Vicki Hoffman (Aus) played the World Women’s Championship final in Toronto, Canada, in 1981, which lasted 1 hour and 57 minutes + 5 minutes warm up. The score was 8-10,9-4,9-5,7-9,9-7 in favour of Rhonda. I do have newspaper clippings to support this. I am currently writing a book on the History of Women’s Squash in Australia from 1930-2010 and I interviewed Rhonda to gain this information. Please contact me if you need further verification. Barbara Slotemaker de Bruine
LikeLike